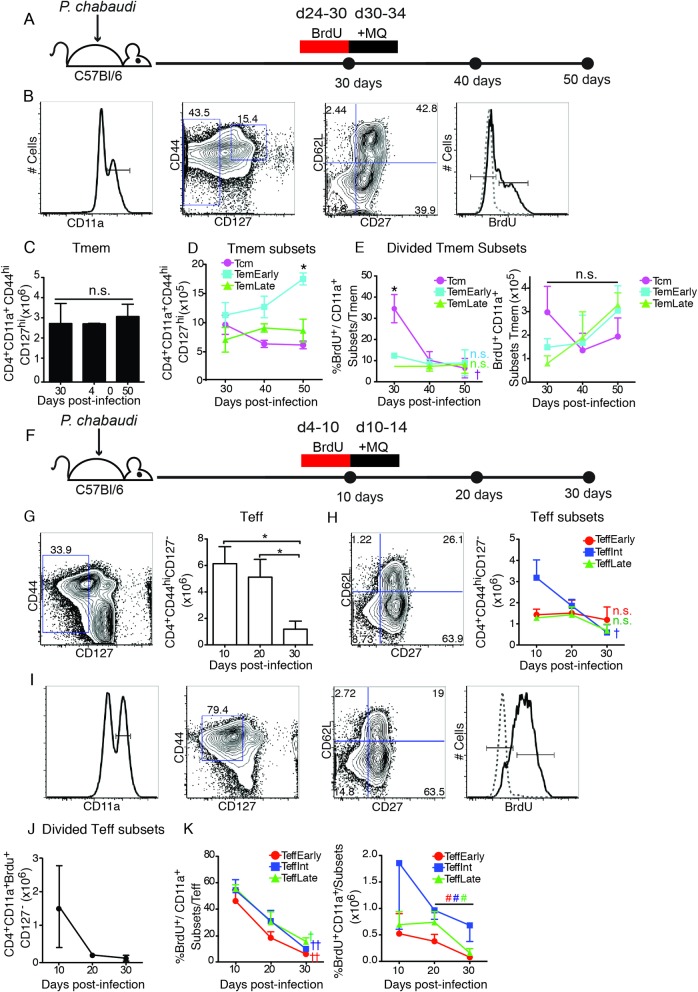
Fig 1. Mature effector T cells decay faster than effector memory T cells in P. chabaudi.
Decay of malaria-specific polyclonal cells was detected by infecting C57Bl/6 mice with P. chabaudi and administration of BrdU either (A-E) during the memory phase (days 24–30), or (F-K) the peak of infection (days 4–10) to label Teff. The day after the end of BrdU administration, the infection was terminated with mefloquine (MQ), and decay of CD4+ memory (CD44hi CD127hi CD11a+, BrdU+/-) and effector (CD127-, (CD11a, BrdU)+/-) T cells in the spleen was determined by flow cytometry. A) Schematic representation of the experimental design for memory phase. B) Plots show the gating strategy for Tmem, including BrdU. Graphs showing C) number of Tmem (CD4+ CD11a+ CD44hi CD127hi) and D) survival of memory T cell subsets in the spleen after parasite clearance. E) Graphs showing percentage (left) and number (right) of cells in each Tmem subset that survive after proliferating days 24–30 (BrdU+). F) Schematic representation of the experimental design to study decay of effector T cells, where BrdU was given days 4–10 p.i., and infection was terminated with MQ days 10–14 p.i. Flow cytometric gating and graphs showing G) number of Teff (CD4+ CD127-) and H) survival of Teff subset populations in the spleen after parasite clearance. I) Plots showing the gating strategy for Teff from CD11a+ to Teff (CD4+ CD11a+ CD44hi CD127lo). Graphs showing J) the number of divided Teff (CD4+ CD11a+ CD127- BrdU+), as they decay after labelling days 4–10 p.i, and subsequent parasite clearance, and K) the percentage (left) and number (right) of cells in each of the divided Teff subsets as they decay. Data represent 3 mice per group. Data was analyzed by Student’s t test and error bars represent SEM. * represents a significant difference between subsets at one timepoint. † represents a significant difference between timepoints d10-d30, or d30-50, # from d20-30 only; one symbol p<0.05, two symbols p<0.01, n.s.–not significant with color coding of symbols to indicate which subset changes.

