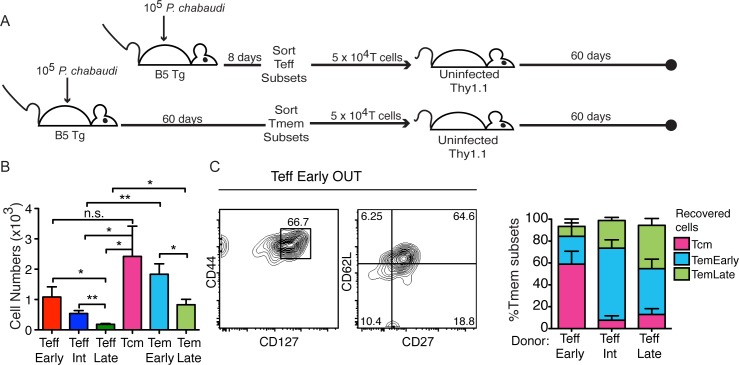
Fig 2. TeffEarly survive like Tmem cells, while highly activated Teff subsets decay.
A) Schematic representation of the experimental design. T cell subsets were sorted from spleens of infected B5 TCR Tg animals (Effector on d8 p.i. (top) and Memory on d60 p.i. (bottom)) and the same number of T cells of each subset (5 x 10⁴) were transferred into uninfected congenic recipients (Thy1.1) for 60 days. B) Graph showing numbers of B5 TCR Tg (CD4+ Thy1.2+) T cells recovered from spleens of recipients of each T cell subset on d60 post-transfer. Data represent 4–9 mice per group from two experiments. Data were analyzed using Student’s t test, **p<0.01, *p<0.05. n.s.–not significant. C) Concatenated contour plot of B5 T cells recovered from TeffEarly recipients day 60 post-transfer showing memory (CD44, CD127) and memory T cell subset (CD62L, CD27) phenotype, and summary graph of Tmem phenotype of recovered T cells from the groups of mice that received each Teff subset. Error bars represent SEM.

