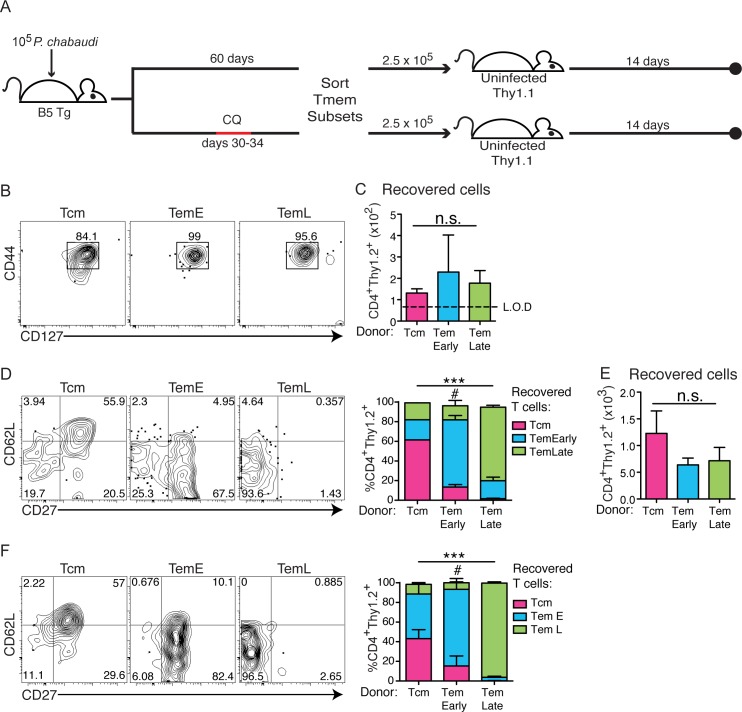
Fig 3. CD4 Memory T cell subsets differentiate from Tcm to TemLate even after elimination of chronic infection.
A) Schematic representation of the experimental design. (top) Memory T cell subsets from infected B5 TCR Tg donors (Thy1.2), that were not treated (A-D), or had been treated (bottom, E, F) with chloroquine (CQ) on days 30–34, were sorted from the spleen (d60 p.i.), and transferred (2.5 x 10⁵) into uninfected congenic (Thy1.1) recipients for 14 days. B) Concatenated contour plots with outliers showing the memory phenotype (CD44, CD127) of all B5 T cells (CD4+ Thy1.2+) recovered from all animals in each group. C) Numbers of B5 T cells recovered from spleens of recipients of Tmem from untreated donors post-transfer. D) Concatenated contour plots and summary stacked bar graph showing memory subset phenotypes (CD62L, CD27) of all B5 memory T cells recovered from all animals in each group. Summary bar graph shows average in each Tmem subset gate on recovery. (E, F) Memory T cell subsets sorted from infected mice treated with anti-malarial drug, CQ, were recovered from uninfected recipients. E) Numbers of B5 T cells recovered from recipients of B5 Tmem from CQ treated donors are shown. F) Concatenated contour plots and summary graph with outliers showing subset phenotypes of B5 Tmem recovered from recipients of B5 Tmem from CQ treated donors. Summary bar graph shows average in each Tmem subset gate on recovery. Data represent 2–3 mice per group. Error bars represent SEM, and n.s–no significant difference between all groups, ***p<0.001 comparing the distribution of the subset phenotypes of B5 T cells recovered in the three groups of recipients, #p<0.05 comparing the fraction of chronically stimulated vs. rested TemEarly donor cells recovered as TemLate in panels D and F.

