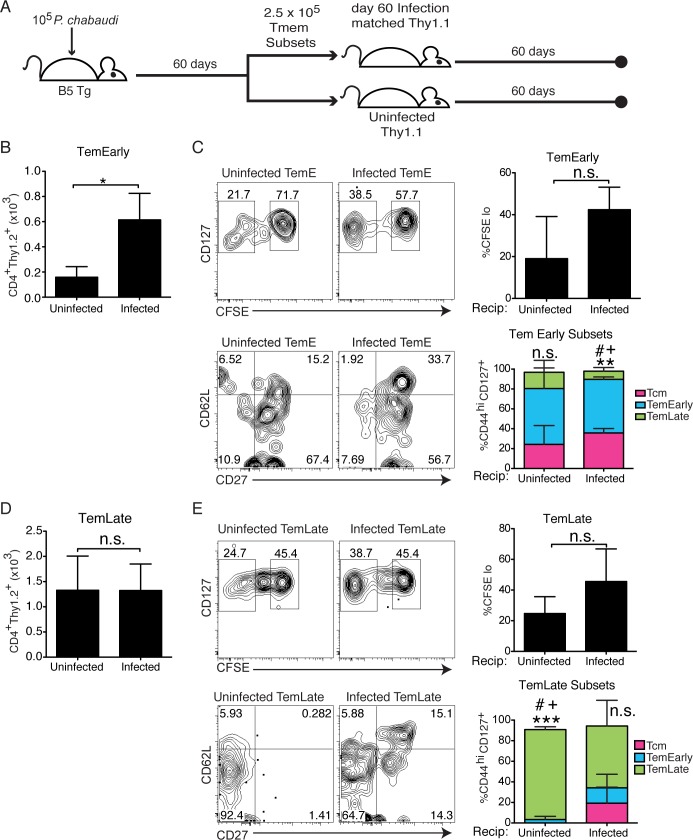
Fig 4. Persistent infection promotes Tem survival.
A) Schematic representation of the experimental design. Memory T cell subsets were sorted from infected B5 TCR Tg mice (d60 p.i.) and the same number of each subset (2.5 x 10⁵) were transferred into either infection-matched (d60 p.i., top) or uninfected (bottom) Thy1.1 hosts for 60 days after transfer. B) Graph shows numbers of recovered B5 T cells (CD4+ Thy1.2+) in recipients of TemEarly. C) Concatenated contour plots show division (CFSE-), and levels of CD127, and phenotypes (CD62L, CD27) of cells recovered from TemEarly recipients. Summary bar graphs show average of divided cells or fraction in each Tmem subset gate on recovery. D) Graph shows numbers of recovered B5 T cells in recipients of TemLate. E) Concatenated contour plots show levels of CFSE, and CD127, and phenotypes (CD62L, CD27) of cells recovered from TemLate recipients. Summary bar graphs show average of divided cells or fraction in each Tmem subset gate on recovery. Data are representative of 2–4 mice per group from 2 similar experiments. Data was analyzed by Student’s t test, and error bar represents SEM, *p<0.05, n.s.–not significant. On summary bar graphs symbols refer to differences between fractions of recovered cells in each Tmem subset in a given stacked bar, one symbol = p<0.05; two symbols, **p<0.01 comparing Tcm to TemL; three symbols, ***p<0.001 comparing TemEarly to TemLate, # comparing Tcm (very few) to TemEarly, + comparing TemEarly to TemLate.

