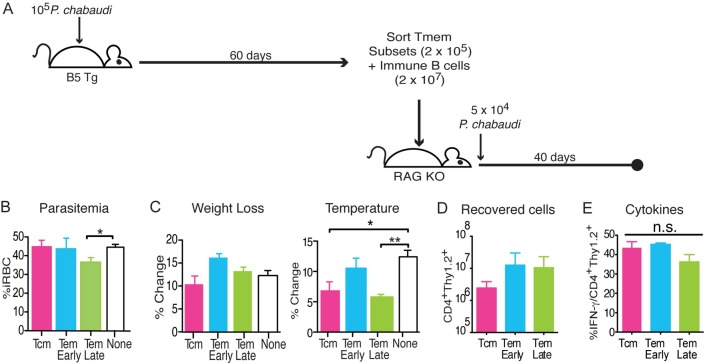
Fig 5. Late effector memory T cells protect immunodeficient animals from malaria.
A) Schematic of the experimental design. Memory T cell subsets were sorted from spleens of infected B5 TCR Tg mice on d60 p.i, and transferred (2 x 10⁵) with immune B cells (2 x 10⁷) into RAG2o mice. Recipient mice were then infected with P. chabaudi (5x10⁴ iRBC). Parasitemia, weight, and temperature were assessed daily for 40 days p.i., and splenocytes were analyzed by flow cytometry on day 40. Graphs of the average B) peak parasitemia, and percent change of C) weight and hypothermia of recipient mice at the peak of each symptom for each recipient (d8-10 p.i.). Flow cytometric analysis summarized here as D) total cell numbers of B5 T cells (CD4+Thy1.2+) recovered and E) the percent of B5 T cells that are IFN-γ+. Data shown represent 3 mice per group and are representative of 5 independent experiments. Error bar represents SEM, *p<0.05, **p<0.01, n.s.–not significant.

