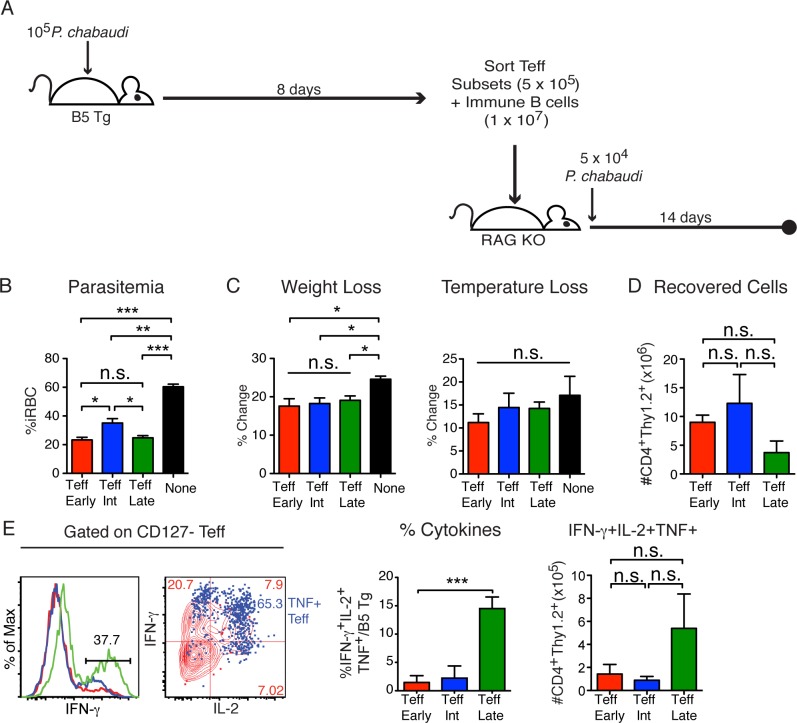
Fig 6. All Effector T cell subsets protect from parasitemia.
A) Schematic of experimental model. Effector T cell subsets were sorted from spleens of B5 TCR Tg on d8 p.i., and transferred (5x10⁵) with immune CD19+ BALB/c B cells (1x10⁷) into RAG2o mice that were then infected with P. chabaudi (5x10⁴ iRBC). Parasitemia and pathology were followed for two weeks. Graphs showing average B) peak parasitemia (%iRBC/RBC) summarized from two experiments (n = 6), C) % change of weight, and hypothermia of recipient mice at the peak of each symptom for each recipient (d8-10 p.i.). Flow cytometry of splenocytes was done on day 14 p.i. and D) graph shows average number of B5 T cells (CD4+Thy1.2+) recovered. E) Histograms, contour overlay (TeffLate), and summary graphs of cytokines produced by T cells from recipients of each Teff subset. Data show 2–3 mice per group and are representative of 3 independent experiments. Error bars show SEM, *p<0.05, **p<0.01, ***p<0.001, n.s–not significant.

