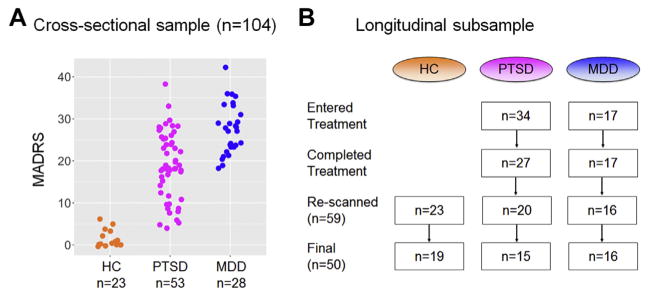
Figure 1.
Participant characteristics. (A) Distribution of Montgomery–Åsberg Depression Rating Scale (MADRS) scores for the cross-sectional sample by diagnostic group. (B) Flowchart of the longitudinal subsample. HC, healthy control subjects; MDD, patients with major depressive disorder; PTSD, patients with posttraumatic stress disorder.

