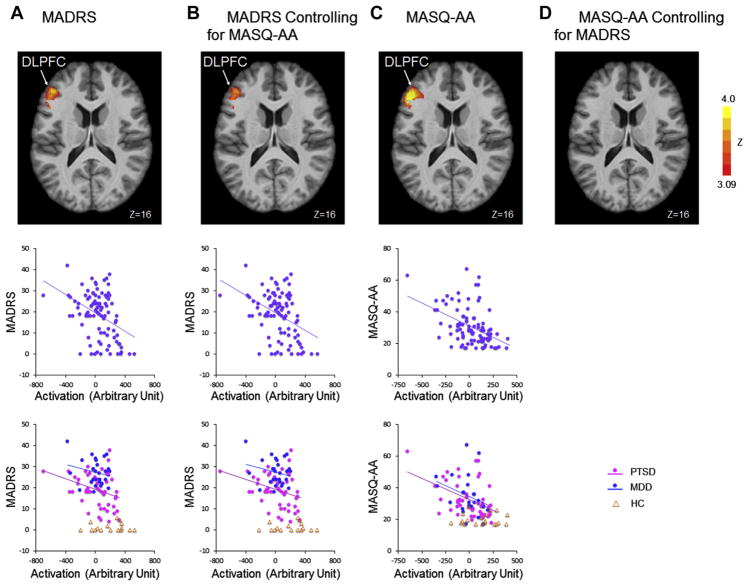
Figure 3.
Activation in cognitive control regions correlates with depression severity across major depressive disorder (MDD) and posttraumatic stress disorder (PTSD) groups at baseline. (A) Brain regions showing significant correlation with Montgomery–Åsberg Depression Rating Scale (MADRS) scores are shown in axial slice view in Montreal Neurological Institute coordinates (Z > 3.09, p < .05, Gaussian random field theory corrected). The cluster mean activations were plotted against the baseline MADRS scores across all subjects. (B) Brain regions showing significant correlation with MADRS scores after regressing out Anxious Arousal subscale of Mood and Anxiety Symptoms Questionnaire (MASQ-AA) scores are shown in axial slice view in Montreal Neurological Institute coordinates (Z > 3.09, p < .05). The residual activation and MADRS scores computed after regressing out MASQ-AA scores were plotted against each other. (C) Brain regions showing significant correlation with MASQ-AA scores are shown in axial slice view in Montreal Neurological Institute coordinates (Z > 3.09, p < .05, Gaussian random field theory corrected). The cluster mean activations were plotted against the baseline MASQ-AA scores across all subjects. (D) Brain regions showing significant correlation with MASQ-AA scores after regressing out MADRS scores. DLPFC, dorsolateral prefrontal cortex. HC, healthy control subjects.

