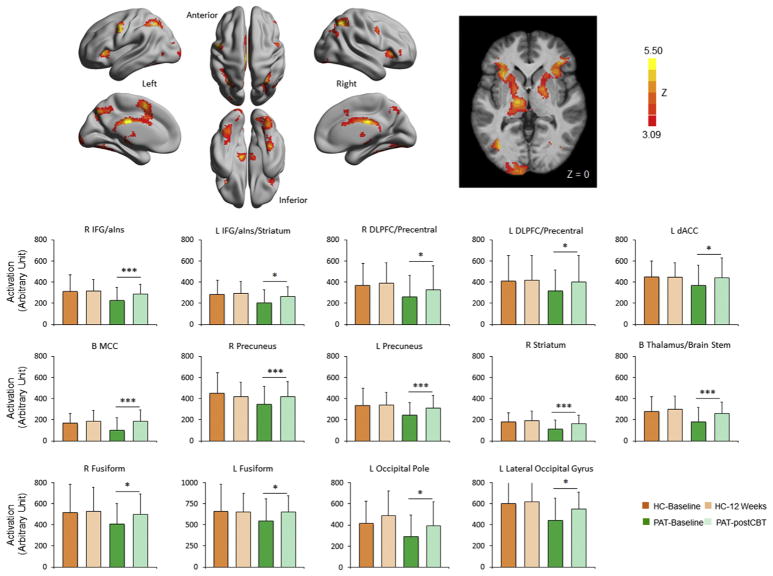
Figure 4.
Longitudinal change in activation following cognitive behavioral therapy in patients. Brain regions where the activation during the conflict task exhibited significant increases (Z > 3.09, p < .05, Gaussian random field theory corrected) following cognitive behavioral therapy (CBT) in patients (PAT) with major depressive disorder or posttraumatic stress disorder are shown on a surface map using BrainNet Viewer (63) and in slice view in Montreal Neurological Institute coordinates. Region of interest mean activation of the 14 clusters showing significant increase in patients following cognitive behavioral therapy treatment are plotted for patients and healthy control subjects (HC) at baseline and at 12 weeks (see Supplemental Table S1 for spatial location of these clusters). None of these clusters showed significant change at 12 weeks in HC. *p < .05; ***p < .005. B, bilateral; dACC, dorsal anterior cingulate cortex; DLPFC, dorsolateral prefrontal cortex; IFG/aIns, inferior frontal gyrus/anterior insula; L, left; MCC, middle cingulate cortex; R, right.

