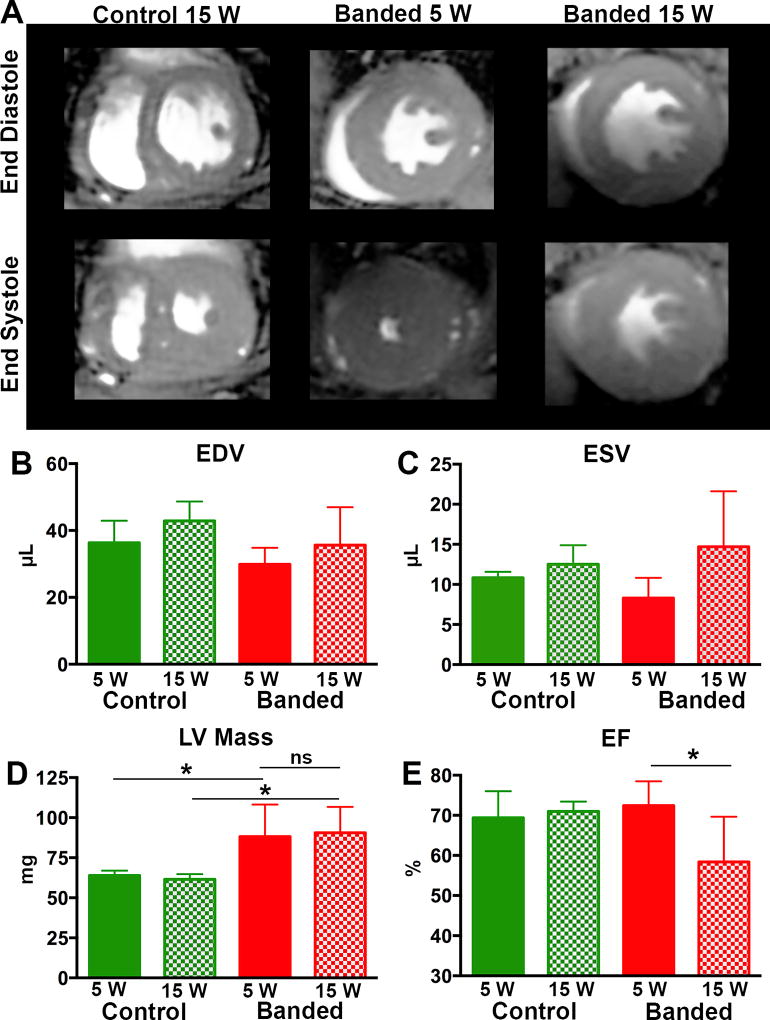
Figure 1. Progressive Cardiac Dysfunction with Prolonged TAC.
(A) Cardiac MRI images showing a mid-ventricular slice at end diastole and end systole for control, 5 weeks post TAC and 15 weeks post TAC mice. EDV (B) and ESV (C). LV mass was increased, compared to controls, at both 5 and 15 weeks but no difference in LV mass was seen between the banded animals at the 5 and 15 week time points (D). However, a significant decrease in ejection fraction (E) was seen at 15 weeks post TAC. (* p < 0.05).

