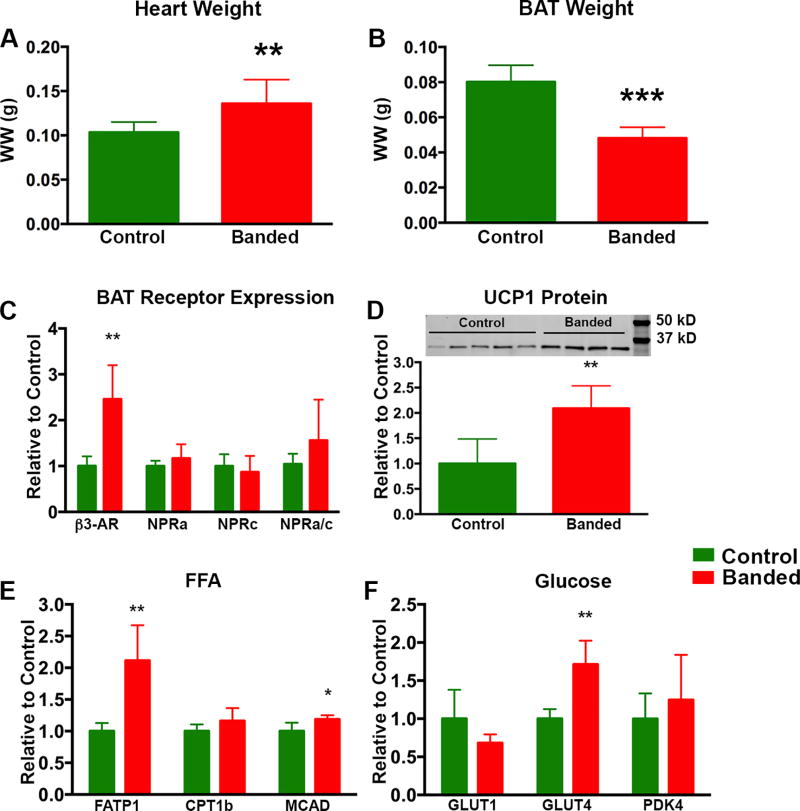
Figure 3. BAT Morphology and Activation State 15 Weeks Post TAC.
At 15 weeks post TAC there was a significant increase in heart wet weight (A) and a significant decrease in BAT wet weight (B) in banded vs control animals. In BAT from banded animals there was a significant increase in β3AR mRNA however, there was no significant change in the NPRa or NPRc receptor levels (C). Although a trend towards an increased NPRa/c ratio remained present, it was not significant. Unlike the 5 week time point, UCP1 protein levels (D) were significantly increased in the banded animals at 15 weeks (normalized to α-tubulin which was unchanged between groups). There was a significant increase in both FATP1 and MCAD mRNA between the two groups and a trend towards increased CPT1B (E). Transcript levels of GLUT1 and PDK4 were unchanged between the two groups at 15 weeks post TAC, however there was a significant increase in GLUT4 mRNA in the BAT of banded vs control animals. (* p < 0.05, **p < 0.01, ***p < 0.001).

