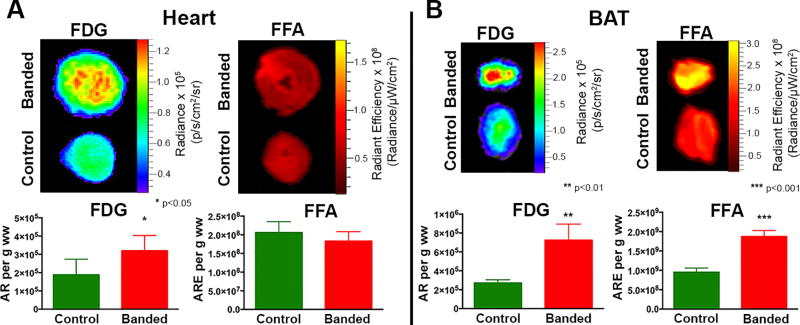
Figure 4. Multiplexed Optical Imaging of Substrate Uptake in the Heart and BAT 15 Weeks Post TAC.
(A) Simultaneous CLI and FRI of glucose and FFA substrate uptake in the heart, 15 weeks post TAC, show a significant increase in glucose uptake and a trend towards decreased FFA uptake. (B) In BAT, significant increases in both glucose and FFA uptake are seen in the banded mice. (*p< 0.05, **p <0.01, ***p<0.001).

