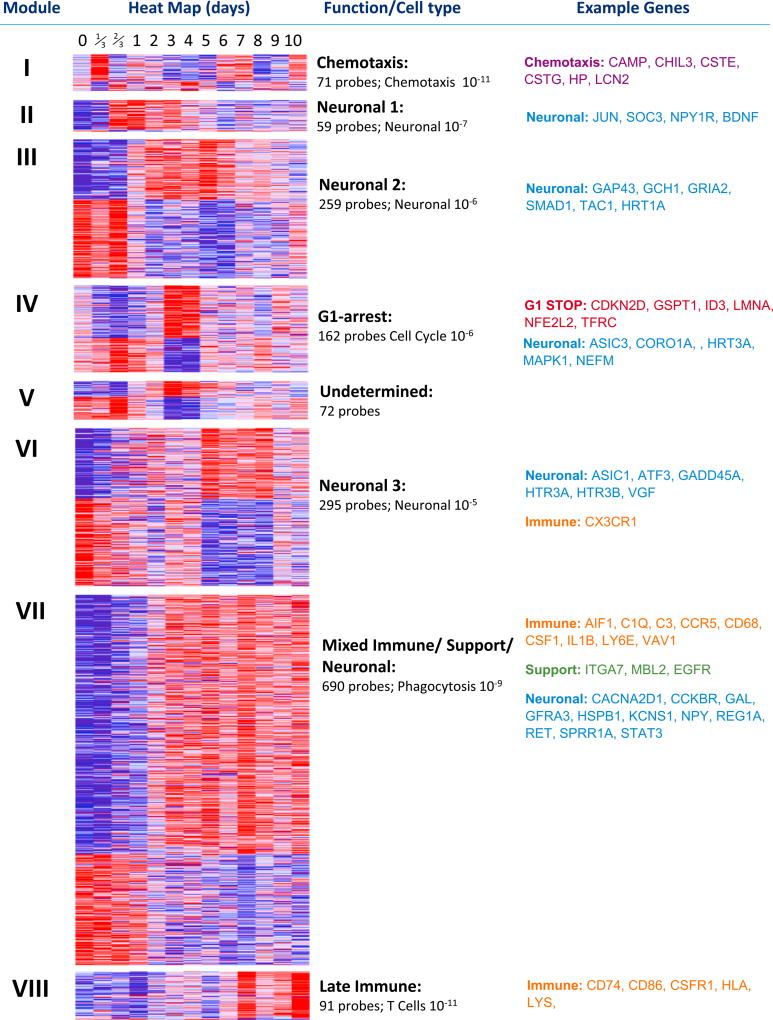
Figure 2. WGCNA Analysis of All Regulated Transcripts in DRG.
Significantly regulated probes (moderated F-statistic, n = 1,704) were subject to WGCNA analysis to produce unbiased clusters of co-regulated transcripts representing the entire regulatory network of transcripts in the DRG following peripheral nerve injury (SNI) for 10 days sampled at least once a day over this period. The first column defines the clusters present, and the second shows heatmaps of each gene in each cluster. Blue represents low-level expression and red high-level expression. The third column gives a brief description of cluster function as defined by IPA software. Below this is the number of probes in each cluster and the p value IPA ascribed the function given. The final column gives example transcripts from each functional subdivision. See also Table S1.

