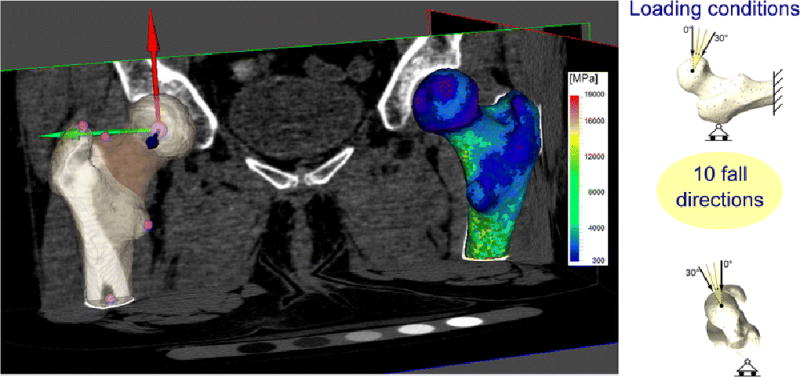
Figure 1.

On the left: the solid model of the patient’s left femur, as segmented from the CT dataset, is shown. Relevant skeletal landmarks used to build the proximal femur coordinate systems (whose origin is the femoral head centre) are shown with spherical markers. The femoral neck ROI used for the evaluation of the fracture risk is highlighted. The finite element model of the right femur with the mapped material properties (Young’s module) is also shown superimposed to the CT dataset. On the right: a schematic of the boundary conditions adopted to simulate a fall to the side.
