
Figure 3. IKKβ Activation Response to Refeeding is Impaired in Ob/Ob Mice.
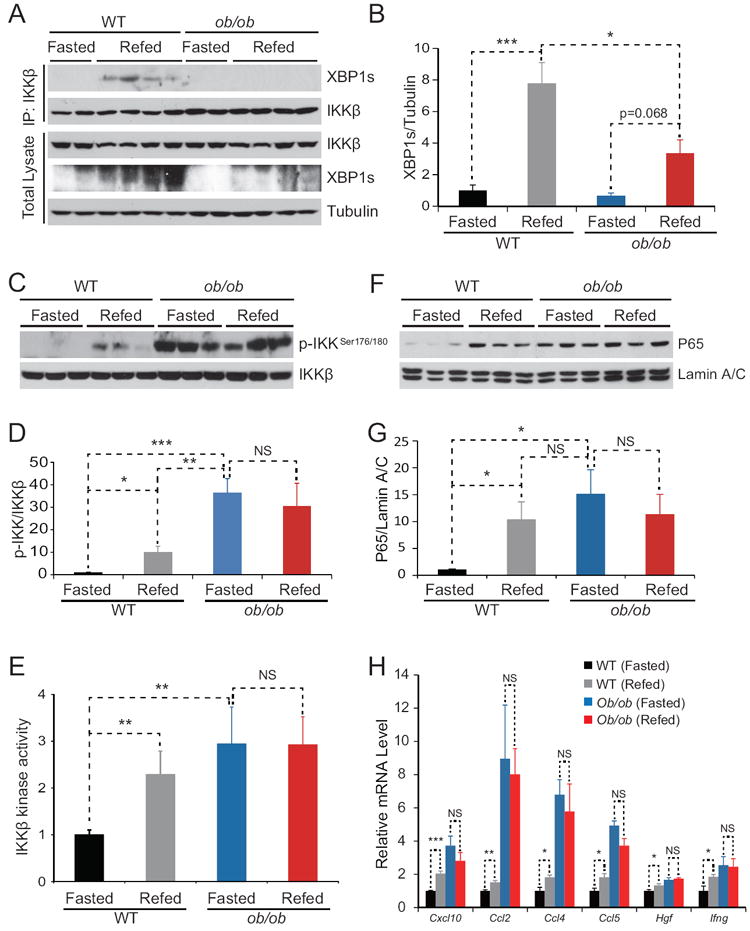
Lean and age-matched ob/ob mice were fasted for 24 hours and refed for 1 hour.
(A) XBP1s Immunoblotting in the IKKβ immunoprecipitates from the liver lysates (top). We specifically loaded two times more amounts of IP samples from the liver of ob/ob mice liver when compared to those of lean mice. XBP1s and tubulin protein levels in total liver lysates (bottom).
(B) Densitometric quantification of ratio of XBP1s protein level to tubulin protein in Figure 3A.
(C) Phospho-IKKβSer176/180 and IKKβ protein levels in total liver lysates.
(D) Densitometric quantification of ratio of Phospho-IKKβSer176/180 level to IKKβ protein level in Figure 3B and Figure S3A (n=6 for each group).
(E) IKKβ activity in mice livers (n=8 for each group). The average of the signals of IKKβ activities in the liver of fasted WT mice were used for normalization of IKKβ activities in the liver in other groups. The IKKβ activities in the four groups are expressed as fold difference.
(F) p65 and Lamin A/C protein levels in nuclear extracts of the liver of WT and ob/ob mice.
(G) Densitometric quantification of the ratio of p65 protein level to Lamin A/C protein in Figure 3E, Figure S3B and S3C (n=9 for each group).
(H) Gene expression levels of Cxcl10, Ccl2, Ccl4, Ccl5, Hgf and Ifng in the liver of WT and ob/ob mice (n=5 for each groups). 18S was used for normalization of gene expression. Error bars are represented as mean ± SEM. Significance was determined by student’s t test. *P < 0.05 **P < 0.01, ***P < 0.001, NS: Non-significance.