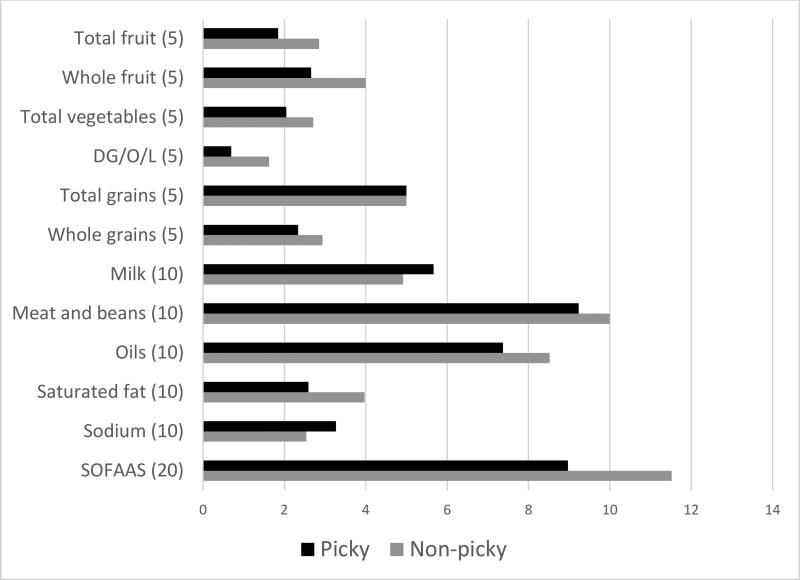
Figure 1.
Baseline mean values on HEI2005 a component scores by baseline pickiness in 136 youth with type 1 diabetes
a Healthy Eating Index-2005 measures conformance to 2005 Dietary Guidelines for Americans and is comprised of 12 subscales: Total fruit, whole fruit, total vegetables, dark green and orange vegetables and legumes (DG/O/L), total grains, whole grains, milk, meat and beans, oils, saturated fat, sodium, and calories from solid fat, alcohol, and added sugar. Higher scores represent better conformance to dietary guidelines. Values in parentheses represent highest possible score for each component.

