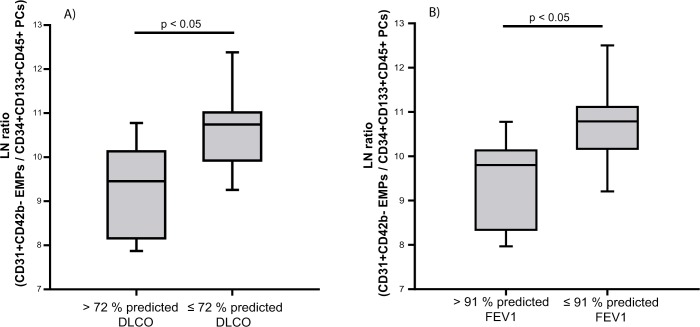
Fig 3. Relationship between the EMPs/PCs ratio and DLco and FEV1 in women.
Subjects were grouped according to (A) DLco and (B) FEV1 above or below the corresponding median value. The box represents the interquartile range and the solid line indicates the median. The whiskers extend from the box to the 90th and 10th percentiles. Ratio values are expressed as ln. Mann-Whitney Rank Sum Test.

