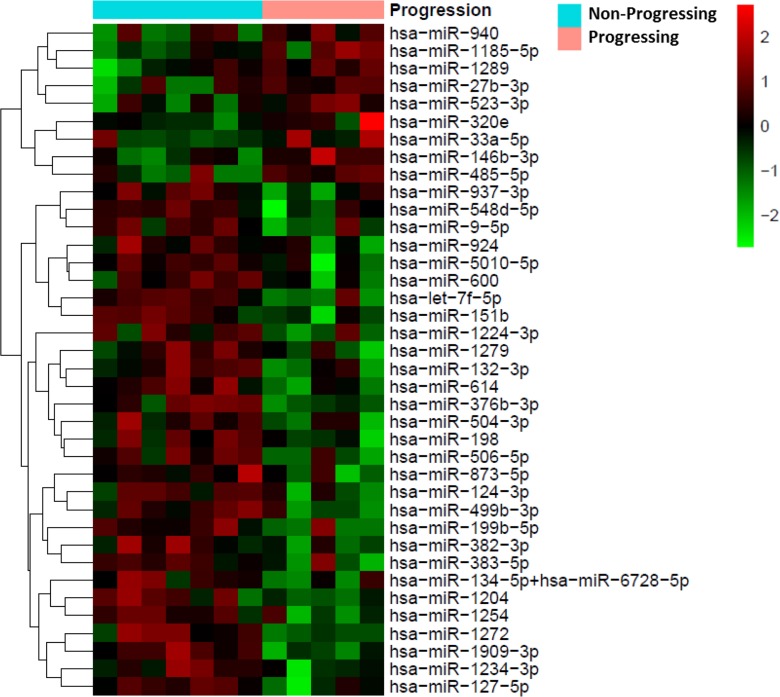
Figure 1. Heat map showing the 38 miRNAs differentially expressed between patients with progressing and non-progressing UTUC (N=12).
Red pixels correspond to a greater abundance of miRNA in the serum samples, whereas green pixels indicate lower miRNA levels. Rows represent individual miRNAs and columns represent experimental samples.

