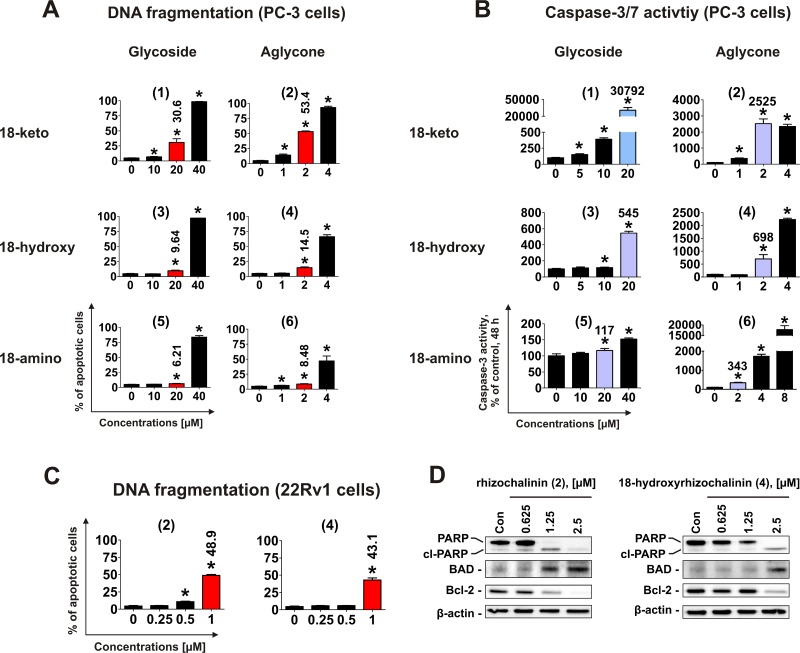
Figure 3. Pro-apoptotic activity of the compounds (1)–(6) in human cancer cells.
(A) Analysis of DNA fragmentation in PC-3 cells treated with compounds (1)–(6) for 48 h at different concentrations. The number of cells with fragmented DNA was assessed with flow cytometry and assumed as the sub-G1 population in cycle analysis. The effects on DNA fragmentation were compared at either 20 μM or 2 μM (red bars on the graphs). (B) Analysis of caspase-3/7 activity in PC-3 cells treated with the investigated compounds at different concentrations for 48 h. The effects on caspase-3/7 activity were compared at either 20 μM or 2 μM (blue bars on the graphs). (C) FACS analysis of DNA fragmentation in 22Rv1 cells treated with compounds (2) and (4) for 48 h at different concentrations. The effects on DNA fragmentation were compared at 1 μM (red bars on the graphs). (D) Analysis of several pro- and anti-apoptotic protein expression in 22Rv1 cells treated with compounds (2) and (4) for 48 h. *p < 0.05 (Student's t-test).

