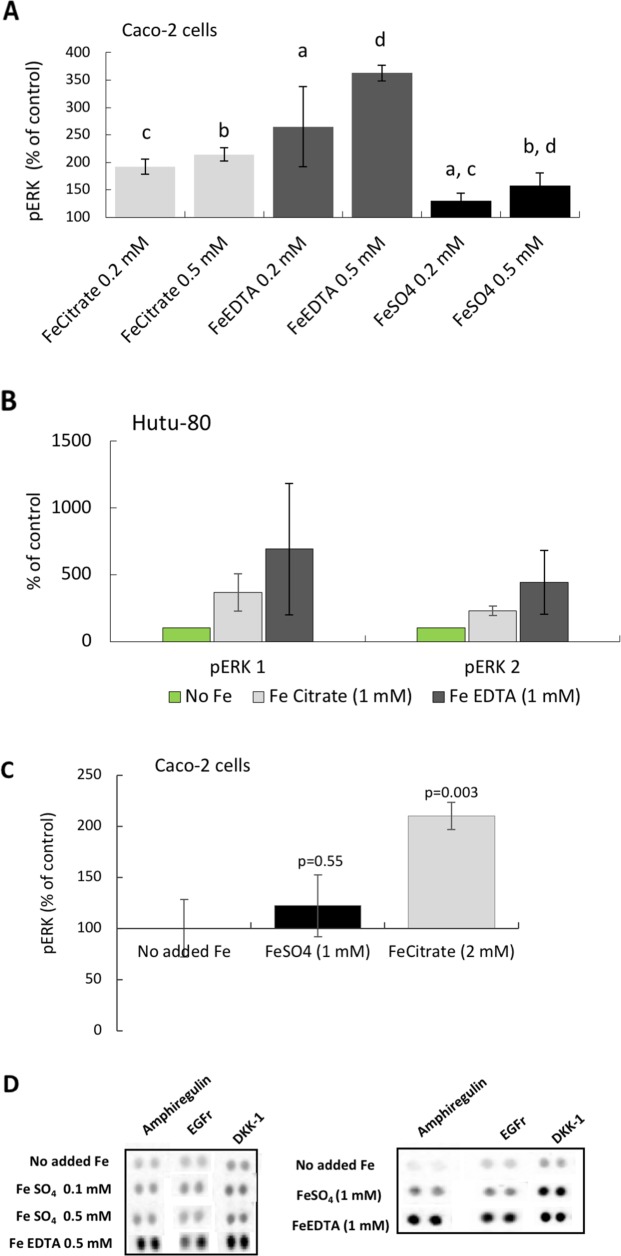
Figure 6. Phosphorylation of the MAP kinases ERK 1 and 2 in epithelial adenocarcinoma cells.
(A) Total phospho-ERK 1 and 2 levels in Caco-2 cells at iron levels that could be found in the human gut. Data are presented as Means ± SD (n=3) measured with instantOne™ phospho-ERK 1/2 assay. The significance of the differences is expressed as letters a-d where a: p=0.05, b: p=0.5, c: p=0.002, d: p=0.04. (B) Western blot data presented as a bar graph (n=2) ofphosphorylated ERK 1 and 2, respectively, in the human epithelia adenocarcinoma cell line Hutu-80 cells at slightly higher than normal gut concentration of iron (1 mM). (C) Total phospho-ERK 1 and 2 levels in Caco-2 cells at slightly higher iron concentration. (D) Protein Array data of amphiregulin, EGFr, and DKK-1 levels at comparative iron concentrations are presented for the purpose of comparison to the phosphorylation (activation) of ERK.

