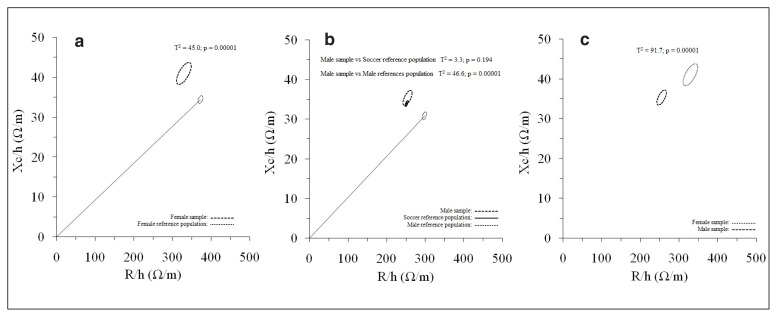
Figure 3.
Whole-body BIVA mean graph. a. The 95% confidence ellipses for the whole-body mean impedance vectors of the female sample (dark dashed line ellipse) and the reference population (dotted line ellipse with vector) are shown21; b. The 95% confidence ellipses for the whole-body mean impedance vectors of the male sample (dark dashed line ellipse), the reference population (dotted line ellipse with vector)21 and the soccer reference population22 are shown; c. the 95% confidence ellipses for the whole-body mean impedance vectors of the female sample (dotted line ellipse) and the male sample (dark dashed line ellipse) are shown. R/h, height-adjusted resistance; Xc/h, height-adjusted reactance.

