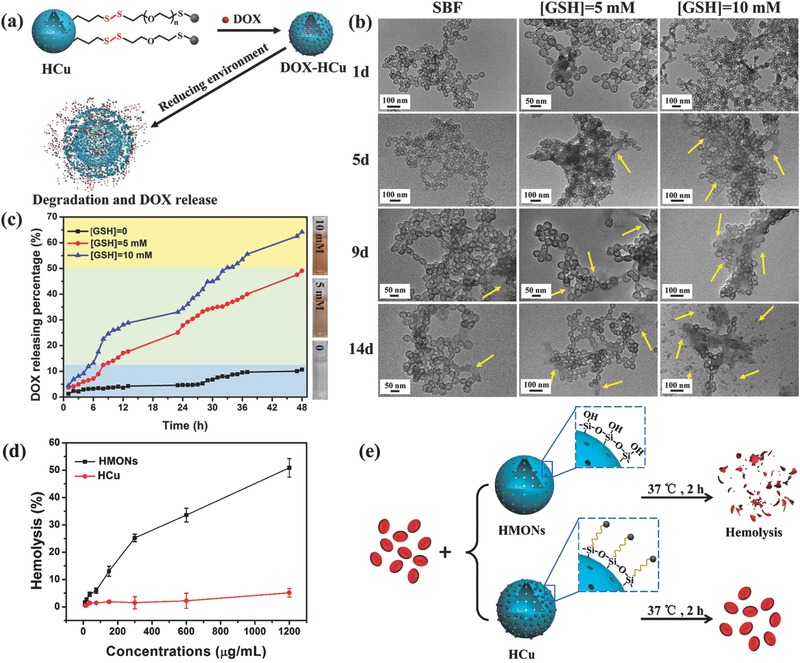
Figure 3.

a) Schematic illustration of the degradation and drug‐releasing behavior of DOX‐HCu under reducing environment. b) TEM images of HCu in SBF solution containing different GSH concentrations (0, 5, and 10 × 10−3 m) for varied durations (1, 5, 9, and 14 d). c) The releasing profiles of anticancer drug from DOX‐HCu in buffer solutions with varied GSH concentrations (0, 5, and 10 × 10−3 m). d) Hemolytic percentage of RBCs incubated with HMONs or HCu at different concentrations. Deionized water and PBS were used as positive and negative controls, respectively. e) Schematic illustration of hemolysis assay procedure and related mechanism.
