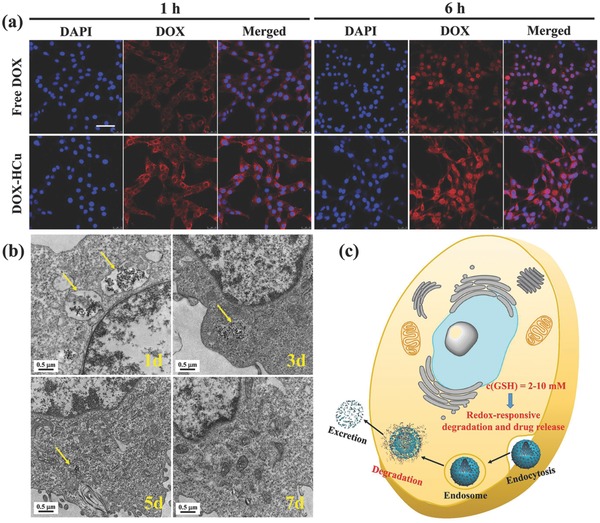
Figure 4.

a) CLSM images of U87 glioma cells after coincubation with free DOX and DOX‐HCu for 1 and 6 h ([DOX] = 10 µg mL−1, blue fluorescence: DAPI, red fluorescence: DOX). Scale bar = 50 µm. b) Bio‐TEM images for intracellular biodegradation behavior of HCu in U87 glioma cells after coincubation for different durations (1, 3, 5, and 7 d). c) Schematic illustration of intracellular uptake and biodegradation of HCu.
