
Figure 6.
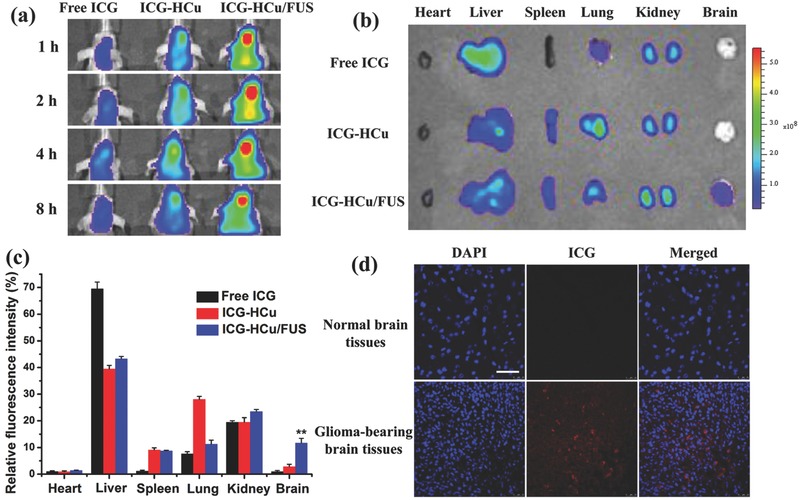
a) In vivo fluorescence images of U87 glioma‐bearing mice after being administrated with free ICG, ICG‐HCu, and ICG‐HCu/FUS at different time points. b) Ex vivo fluorescence images of major organs and brains harvested at 4 h postinjection. c) The quantified relative fluorescence intensity in different organs. **p < 0.01. d) Confocal images of normal brain tissues and ICG‐HCu/FUS treated glioma‐bearing brain tissues. Blue: cell nuclei; Red: ICG‐HCu. Scale bar: 50 µm.