
Figure 1.
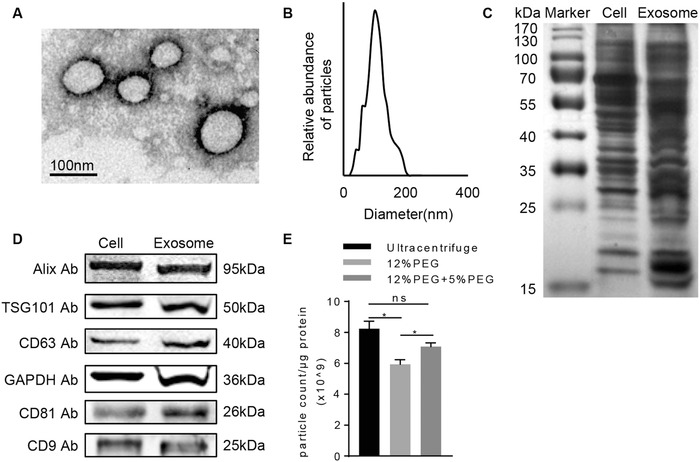
Characterization of HEK293FT cell‐derived exosomes. A) Representative electron microscopy image of the exosomes isolated from HEK293FT cells. Scale bar, 100 nm. B) Size distribution of HEK293FT cell derived exosomes determined by dynamic light scattering. Data represent 20 measurements of four biological samples. C) The protein profile of HEK293FT cells and the exosomes secreted by HEK293FT cells were analyzed by silver blotting. Representative image of three different experiments. D) The protein levels of Alix, TSG101, CD63, CD81, CD9, and GAPDH in HEK293FT cell lysates and the exosomes secreted by HEK293FT cells were analyzed by western blot. Data presented were representative of three different experiments. E) Particle‐to‐protein ratio of exosomes isolated by ultracentrifugation, 12% PEG 6000 precipitation and 12% precipitation + 5% PEG 6000 reprecipitation. Data were expressed as mean ± standard deviation (SD) of three different experiments. *p < 0.05.