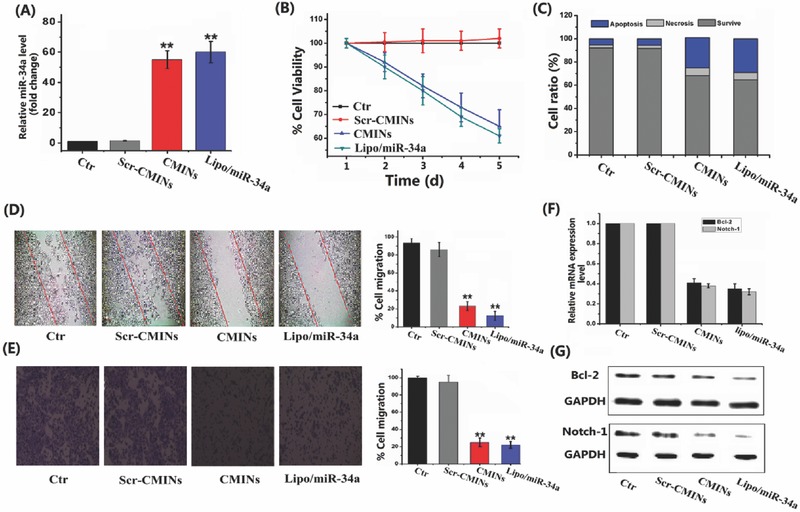
Figure 4.

Biological effects of CMINs‐mediated replacement of miR‐34a in HepG‐2 cancer cells. A) Relative miR‐34a level in cancer cells at 48 h post‐treatment with Scr‐CMINs, CMINs and lipo/miR‐34a. B) Cell proliferation was quantitatively measured by using a cell counting kit‐8 (CCK‐8). C) Cell apoptosis was analyzed by flow cytometry. Apoptotic evaluation was illustrated by the percentage of apoptotic cell number relative to total cell number. D) Wound healing and E) transwell assays were conducted to evaluate cell migration. Migration ratio was quantitatively shown by normalized gray values. The expression of Bcl‐2 and Notch‐1 in HepG‐2 cells 48 h after treatment with different formulations by F) RT‐PCR and G) western blot analysis. Data were represented by mean ± SD (n = 3, Student's t‐test, **p < 0.01).
