
Figure 2. Overview of the expression casette used for plant transformation and the gene expression strength of the transformed Nicotiana attenuata plants.
(A) The peptide Mc-AMP1 (‘ICE’) from the common ice plant (Mesembryanthemum crystallinum) was constitutively expressed under a 35S promoter. The amino acid sequence of the pro-peptide is shown with the signal peptide in red and the mature domain in blue. Connection pattern of the conserved cysteine residues are indicated. (B) Uniformity in gene expression strength in rosette leaves of independently transformed N. attenuata ICE lines in the T4 generation. Bars indicate the log2 fold AMP expression levels which were 23.1 fold (±6.0) higher relative to actin as the reference gene (±SD, n = 4 plants). (C) The ICE lines showed no pleiotropic effects on plant morphology associated with AMP expression.
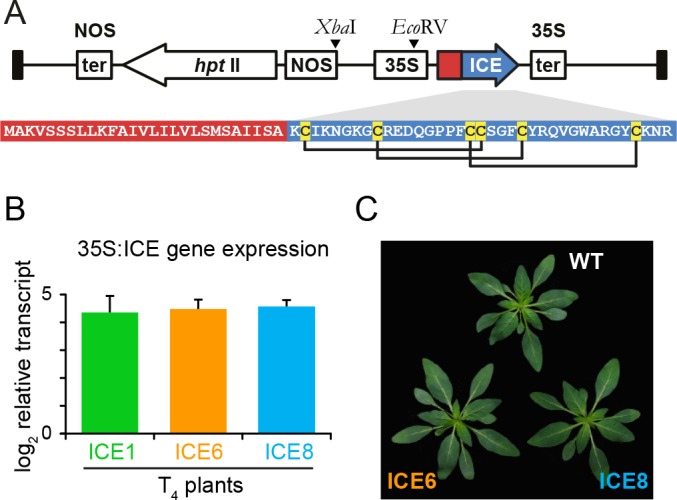
Figure 2—figure supplement 1. Multiple sequence alignments of knottin-like peptides.

The peptide (Mc-AMP1) from the common ice plant was used for ectopic expression and showed sequence similarities to other peptides from plants (all within the Caryophyllales) insects (Coleoptera; Hemiptera) and fungi (Hypocreales). Sequences were retrieved from GenBank and signal peptides were removed using the SignalP 4.1 Server before alignment in Geneious version 6.0.5 (http://www.geneious.com) using the ClustalW algorithm. Accession numbers: Mc-AMP1 [AF069321], MJ-AMP2 [U15539], MJ-AMP1 [U15538], AFPS-1 [AF048745], Alo-1 [P83651], Alo-2 [P83652], Alo-3 [P83653], Btk-4 [ABC40572], C. militaris antifungal_toxin [XP_006665522], B. bassiana hypothetical protein [XP_008602399].
Figure 2—figure supplement 2. Selection scheme for ICE overexpression lines harboring a single copy of the transgene.

(A) Segregation analysis of the resistance marker loci was determined by germinating seedlings of N. attenuata on antibiotic containing medium. Three lines from independent regeneration events (ICE 1, ICE 6 and ICE 8) indicated the presence of two T-DNA loci (T1 segregation rate aproximating 6.25%). The first homozygous generation (T2) harbored multiple insertions and was excluded from further analysis. Alternatively selected T2 plants with hemizygous segregation patterns (25% sensitive seedlings) were further propagated and resulted in plants with single T-DNA insertions that were used for experiments (T4 generation). (B) Southern blot analysis for the determination of T-DNA copy numbers as performed in Weinhold et al., 2013. Genomic DNA was isolated from homozygous seedlings and digested in separate reactions with XbaI or EcoRV. A radiolabeled fragment of the hygromycin resistance gene (hptII) served as probe. All plants used for experiments showed single T-DNA insertions. Coincidently, the two loci of line ICE 1.2 were separated by segregation and resulted in plants with insertions at different positions (ICE 1.1.1 and ICE 1.5.2 highlighted with a red and green arrow).
Figure 2—figure supplement 3. Transgene expression and peptide accumulation had no pleiotropic effects on plant growth and development in the glasshouse.

(A) Transgene expression strength from seedlings shown as log2 fold expression to actin (±SD, n = 4 plates a 30 seedlings). Different letters indicate significant differences (p≤0.05, Mann-Whitney U Test, following Kruskal-Wallis Test). (B) Immunoblot detection of the ectopically expressed peptide within roots and leaves of transgenic N. attenuata plants. For each sample a total of 40 µg protein was used for gel-electrophoresis. Coomassie Brilliant Blue staining (CBB) was used as loading control. (C) Transgenic plants (line ICE 6 and ICE 8) showed no growth reduction compared to WT in the glasshouse. Rosette diameter and stalk height were quantified in the glasshouse until 46 d post germination. Plants were distributed in a randomized design. Pictures depict plants at 30 and 40 d post germination (±SEM, n = 28 plants, Mann-Whitney U Test, following Kruskal-Wallis Test; *p≤0.05).