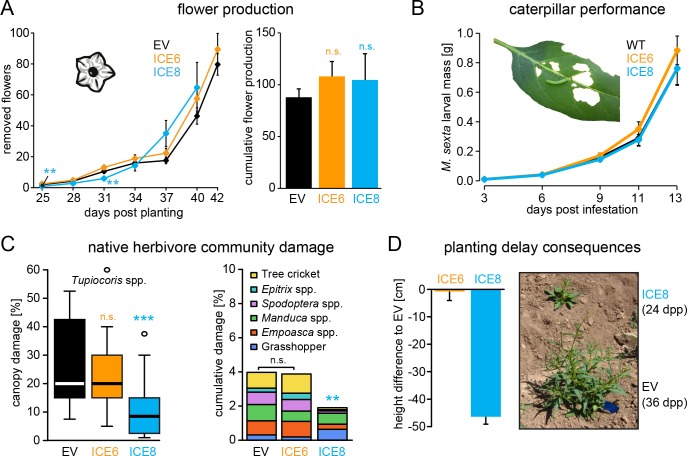
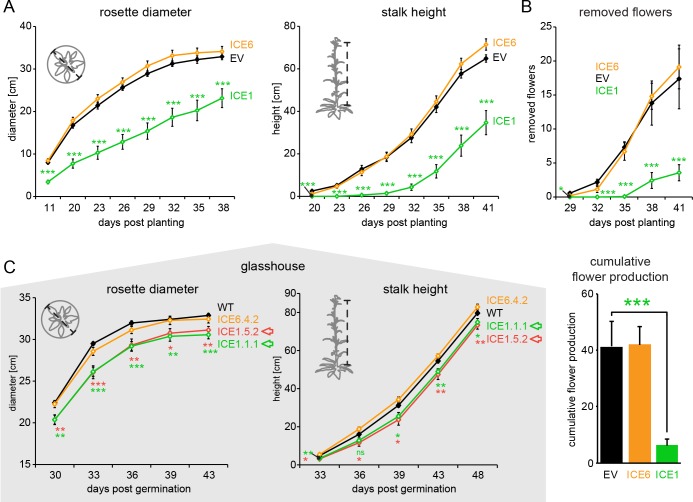
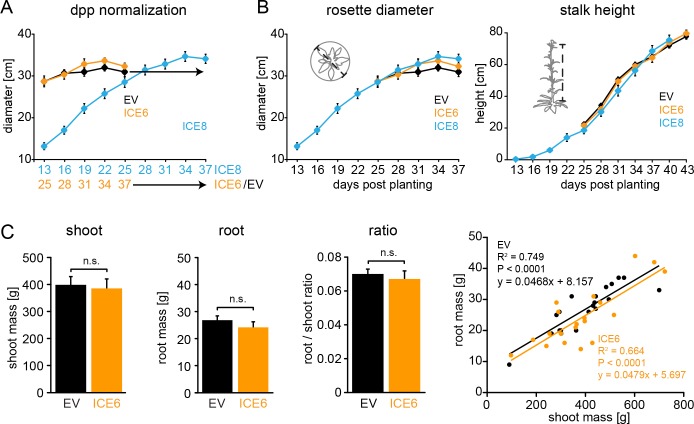
Figure 4. Antimicrobial peptide expression had no negative fitness consequences for field-grown plants.
N. attenuata ICE-lines were compared with empty vector controls (EV) in a field experiment at the Lytle ranch preserve Utah (USA). (A) Elongated flowers and flower buds were removed before opening in a three-day interval and normalized against days post planting to compensate the planting delay of 12 days for the ICE 8 plants. For the cumulative flower production all removed flowers per genotype were summed from 25 to 40 dpp (±SEM, n = 20 plants; Mann-Whitney U Test following Kruskal-Wallis Test: **p≤0.01, n.s. = not significant). (B) Larval performance of the tobacco hornworm (Manduca sexta) did not differ in WT and transgenic ICE lines in the glasshouse (±SEM, n = 18–22 larvae). (C) Herbivore damage from the native herbivore community did not differ among EV and ICE 6 plants. The graphs show the estimated % canopy damage averaged from the assessments of two independent researchers (±SEM, n = 20 plants). Except for the sap-sucking herbivore Tupiocoris spp. (Heteroptera: Miridae) most herbivores showed damage with low abundance (<1%). The median is shown as the centered line, limited by the 25th and 75th percentiles and 1.5 times extended whiskers after Tukey. Only line ICE 8 (planted with delay) showed significantly less herbivore damage compared to EV (Mann-Whitney U test following Kruskal-Wallis Test; **p≤0.01; ***p≤0.001). (D) At the time of the herbivore screening ICE 8 and EV plants showed an average height difference of 46.5 cm (±2.7 cm) due to the delay in planting, EV and ICE 6 plants did not differ.


