. 2018 Apr 17;7:e28715. doi: 10.7554/eLife.28715

Figure 6. The overall composition of the root-associated microbial communities from field-grown plants did not differ between genotypes and showed marginal effects at the genus level.

(A) Root samples from ten equal sized plant pairs of empty vector control (EV) and ICE 8 plants were used for sequencing. (B) Comparison of the relative abundances of the major phyla (respective classes for Protobacteria) of the root-associated microbial communities of field-grown plants. (C) Communities were clustered by principal coordinates analysis (PCoA) using the weighted and unweighted UniFrac as a distance measure (genotype: EV = black, ICE 8 = blue). (D) The filtered community data was used to visualize the distribution of all 59 families in a heatmap showing log10 (+1) transformed abundance. Samples were clustered hierarchically by UPGMA based on Bray–Curtis dissimilarity. Similarity percentage analysis (SIMPER) was performed to evaluate sample dissimilarity contribution [%] for each family based on their relative abundance. Only families with >1% dissimilarity contribution are indicated by name. Color coding of the bars indicate higher phyla and classes as used in B. (E) Group significance tests revealed significant differences between control and antimicrobial peptide expressing plants at the genus level for ‘Leifsonia’ (Microbacteriaceae), Pantoea (Enterobacteriaceae) and ‘Pedobacter_g3’ (Sphingobacteraceae) (non-parametric t-test, *p<0.05 after correcting for a false discovery rate of 10%).

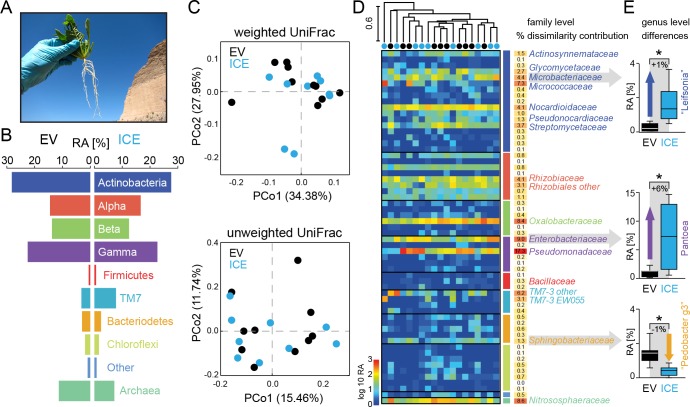
Figure 6—source data 1. Group significance comparisons from phylum to genus level.
DOI: 10.7554/eLife.28715.018

Figure 6.

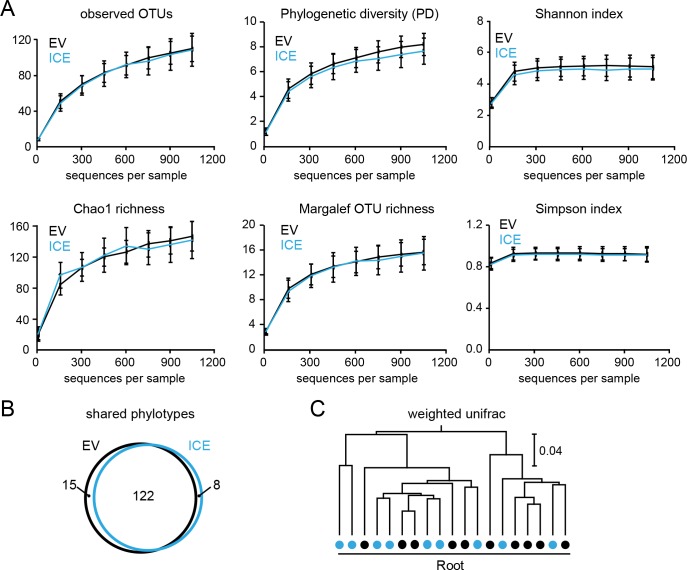
Figure 6—figure supplement 1. Diversities of the root-associated microbial communities did not differ between genotypes in field-grown plants.

Figure 6—figure supplement 1.

(A) Rarefaction analysis of the root-associated microbial communities using different alpha diversity measures indicates no genotype differences (EV = black, ICE 8 = blue). (B) Venn diagram showing the shared phylotypes (genus level) of the rarefied root communities (areas proportional). (C) Hierarchical clustering of the root-associated communities from ten individual plant pairs using the weighted UniFrac as a distance measure indicates no separation by genotype (EV = black, ICE 8 = blue).
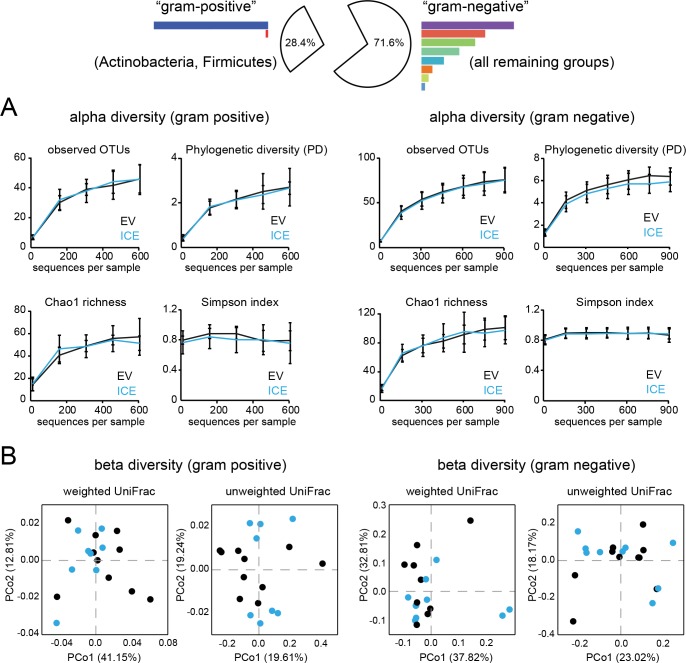
Figure 6—figure supplement 2. Diversity analysis of the root-associated microbial communities from field-grown plants separated by gram type.

Figure 6—figure supplement 2.

The root-associated communities were divided into ‘gram-positive’ (Actinobacteria and Firmicutes) and ‘gram-negative’ taxa (all remaining groups) for separate analysis. (A) Rarefaction analysis of the root-associated microbial communities separated by gram-positive and gram-negative groups using different alpha diversity measures. (B) Beta diversity as principal coordinates analysis (PCoA) using the weighted and unweighted UniFrac as a distance measure (EV = black, ICE 8 = blue).
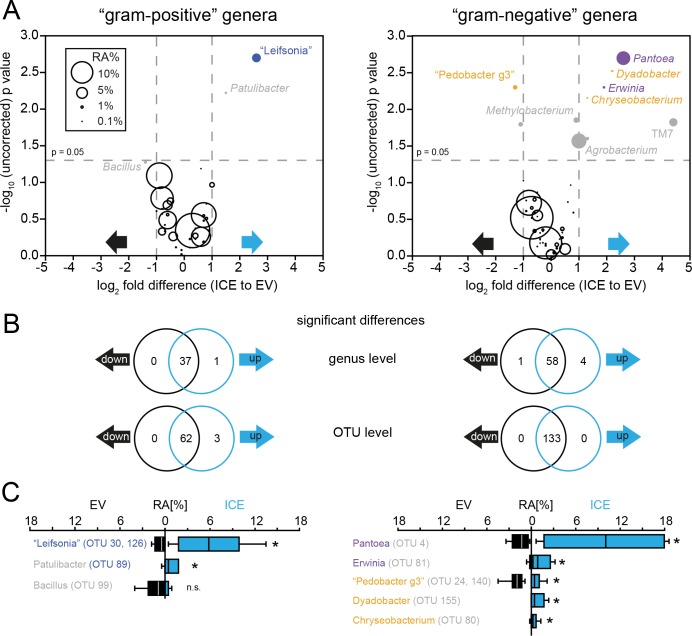
Figure 6—figure supplement 3. Genotype differences of the root-associated communities at genus and OTU level separated by gram type.

Figure 6—figure supplement 3.

(A) Volcano plot showing genera with differences in relative abundance among the genotypes on the x-axis (as log2 fold difference) and the -log10 (uncorrected) p value on the y-axis. Bubble size indicates relative abundance averaged from both genotypes. Genera which remained significant after correcting for a false discovery rate (FDR) of 10% are shown in color. Actinobacteria are shown in blue, Gammaproteobacteria in purple and Bacteroidetes in orange. (B) Venn diagrams showing significant differences at genus and at OTU-levels separated by gram type (up and down refers to an increase or decrease in the ICE genotype). (C) Relative abundances of the genera that showed significant differences among the genotypes. Patulibacter was only significant at OTU level. (non-parametric t-test with FDR correction of 10%).