. 2018 Apr 17;7:e28715. doi: 10.7554/eLife.28715

Figure 7. Experimental infiltrations of bacterial isolates from different taxa demonstrate the specificity of the antimicrobial activity.

(A) Summary of the in planta antimicrobial effects obtained by individual infiltrations of bacterial isolates into transgenic and control plants, as shown in Figure 7—figure supplement 1  and Figure 7—figure supplement 2. Bars represent the effect size (averaged log10 CFU fold reduction to WT) calculated by dividing the CFUs obtained from WT by the CFUs obtained from the transgenic plants (ICE 6 and ICE 8) from 2 to 6 dpi or 6 hpi (only B. megaterium). The relative phylogenetic grouping of the bacterial strains is illustrated by a neighbor-joining tree, generated from the alignment of the nearly complete 16S rDNA sequences (Figure 7—source data 1). Bootstrap supported values (1000 replicates) are indicated on individual nodes. The theoretical OTU clustering (97% similarity of the pyrosequencing amplicon) is indicated by the gaps in the background color (Firmicutes in red, Actinobacteria in blue and Proteobacteria in green). (B) Native isolates of Bacillus megaterium showed strain specific susceptibilities to the transgenic plants. Bacteria were injected in the leaves by pressure infiltration and re-isolated after 6 hr (±SD, n = 4 plants). Asterisks indicate statistically significant differences between WT and transgenic plants (students t-test; ***p≤0.001).

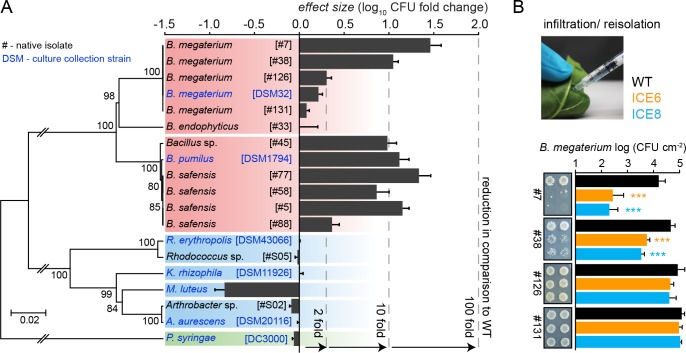
Figure 7—source data 1. Table of bacterial isolates and culture collection strains used for experimental infiltrations.
DOI: 10.7554/eLife.28715.027

Figure 7.

Figure 7—figure supplement 1. In planta activity of N. attenuata ICE lines against Actinobacteria. .

Figure 7—figure supplement 1.

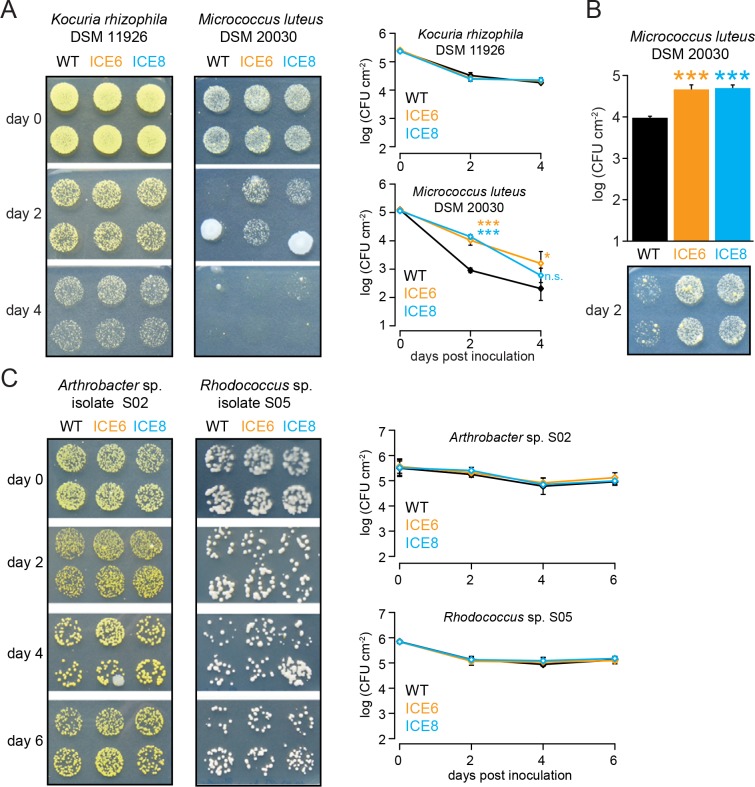
(A) Kocuria rhizophila DSM 11926 and Micrococcus luteus DSM 20030 were injected by pressure infiltration into fully expanded rosette-stage leaves (OD600 = 0.2). The mean colony forming units (CFU) were plotted as log CFU cm−2 leaf area (±SD, n = 4 plants). M. luteus showed a CFU increase in the transgenic lines. Asterisks indicate statistically significant differences between WT and the transgenic plants (students t-test; *p≤0.05; ***p≤0.001; n.s. = not significant). (B) Repetition of the M. luteus infiltration using a higher cell number (OD600 = 0.4) resulting in a similar outcome at 2 dpi with an increased CFU number in the transgenic lines (students t-test; p<0.001). (C) Arthrobacter sp. #S02 and Rhodococcus sp. #S05 isolates were injected by pressure infiltration into fully expanded rosette-stage leaves. The mean colony forming units (CFU) were plotted as log CFU cm−2 leaf area (±SD, n = 4 plants) indicating no CFU reduction for the tested bacteria.
Figure 7—figure supplement 2. In planta activity of N. attenuata ICE lines against Bacillus isolates. .

Figure 7—figure supplement 2.

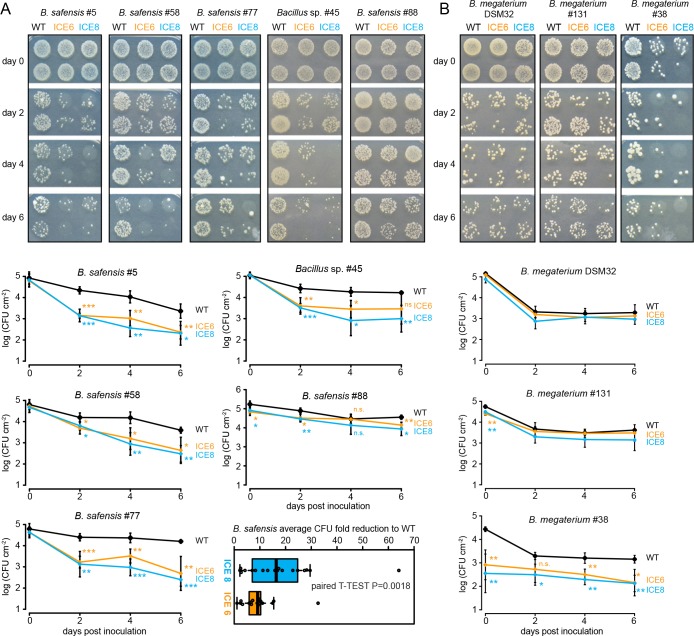
Different endophytic isolates were injected by pressure infiltration into fully expanded rosette-stage leaves and re-isolated at 0, 2, 4 and 6 dpi. The pictures show two technical replicates per genotype and time point. The mean colony forming units (CFU) were plotted as log CFU cm−2 leaf area (±SD, n = 4 plants). Asterisks indicate statistically significant differences between WT and transgenic plants (t-test; *p≤0.05; **p≤0.01; ***p≤0.001; n.s. = not significant). (A) For the isolates of the Bacillus pumilus/safensis clade #5, #58, #77, #45 and #88 the consolidated results indicated stronger CFU fold reductions for line ICE 8 compared to line ICE 6. Dots represent average values at 2–6 dpi with the medians as the centered lines limited by 25th and 75th percentiles and 1.5 times extended whiskers after Tukey (n = 18 sample points; paired t-test; p<0.002). (B) Infiltration of the Bacillus megaterium type strain DSM32, isolates #131 and #38.
Figure 7—figure supplement 3. Long-term inoculations showed no difference in root colonization for B. megaterium nor evidence of AMP resistance development in the transgenic plants. .

Figure 7—figure supplement 3.

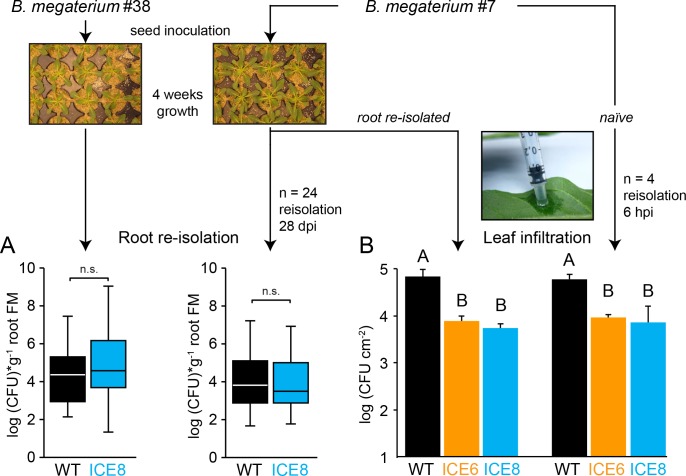
(A) Surface sterilized seeds were inoculated overnight in bacterial solution (B. megaterium isolate #38 or isolate #7 OD600 1.0). Plants were grown in sand and bacteria re-isolated at 28–30 days post inoculation (dpi) from surface sterilized roots (n = 24 plants). The median is shown as the centered line, limited by the 25th and 75th percentiles and 1.5 times extended whiskers after Tukey. (n.s. = not significant, Mann-Whitney U Test). (B) To test if bacteria might develop peptide tolerance, the root re-isolated strain (grown for 4 weeks within the transgenic plants) was re-infiltrated into leaves and re-isolated 6 hr post infiltration (hpi) (±SD, n = 4 plants). The re-isolated strain showed no differences to the naïve strain. Different letters indicate significant differences (p≤0.05, Mann-Whitney U Test, following Kruskal-Wallis Test).