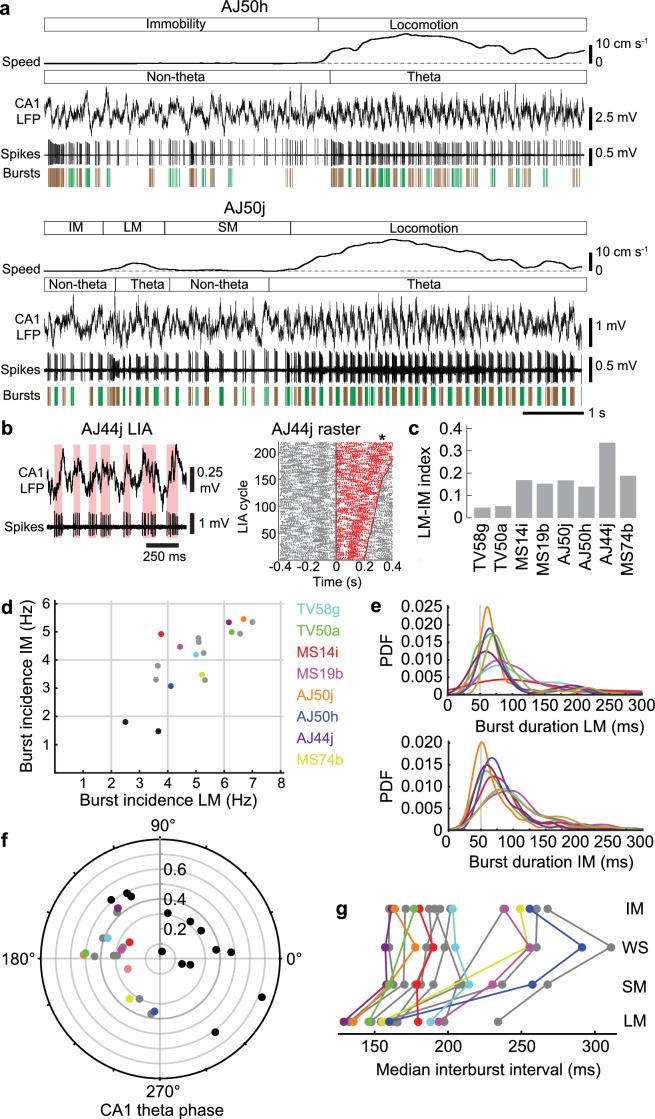
Figure 5. Orchid cell firing reflects behavioral states.
(a) Firing of orchid cells AJ50h (top) and AJ50j (bottom), recorded consecutively in the same session. Algorithm detected bursts are shown below spikes (sequential bursts marked alternately green and brown). Note periods of theta oscillations and non-theta periods during different behavioral states. (b) Left, rhythmic burst firing of orchid cell AJ44j during CA1 LIA (‘non-theta’ periods), with red bars highlighting bursts aligned mostly to the ascending/peak phase of LIA oscillations. Right, raster of spikes within (red) and outside (gray) zero-crossings of LIA cycles, ordered by cycle length (minimum interval 200 ms). Time 0 marks the falling transition of the LFP (zero crossing). Asterisk, position of the peak of the LFP during slower LIA cycles, corresponding to greater spike counts. (c), Mean firing rate index for different states (IM versus LM) for identified orchid cells. All neurons increase their firing from IM to LM. (d) Burst incidence during IM versus LM for identified orchid cells (color-coded, cell IDs on right side), putative orchid cells (gray) and septo-hippocampal cells (black). (e) Probability density functions (PDF) of burst durations of identified orchid cells (color-coded as in c) during LM (top) and IM (bottom), showing that peak burst durations are greater than 50 ms (gray line). (f) Preferred CA1 theta phase (degrees) of identified orchid cells (color-coded as in d), putative orchid cells (gray), and identified Teevra cells (black, cells from Joshi et al., 2017); vector length as radial axis (r). (g) Median interburst interval for identified and putative orchid cells during different behavioral states (points; some neurons lack particular states). LM, locomotion; SM, small movements; WS, whisking/sniffing without movement; IM, immobility.


