. 2018 Apr 5;7:e34395. doi: 10.7554/eLife.34395

Figure 7. Proportions of MSDB neurons immunoreactive for PV, SATB1 and mGluR1a.

(a) Confocal microscopic z-projection (3 µm thick) of SATB1 (green), PV (magenta) and mGluR1a (cyan) immunoreactivity in the MS. Arrows, two PV+/SATB1+/mGluR1a+ neurons. Arrowhead, PV+/SATB1–/mGluR1a– neuron. Double arrowhead, PV–/SATB1+/mGluR1+ neuron. DAPI, yellow. Scale bar, 50 µm. (b) Stereological estimation of neuronal subpopulations in the MSDB immunoreactive for combinations of PV (P), SATB1 (S) and mGluR1a (G). Total estimated counts are shown above each bar. Error bars, standard error.

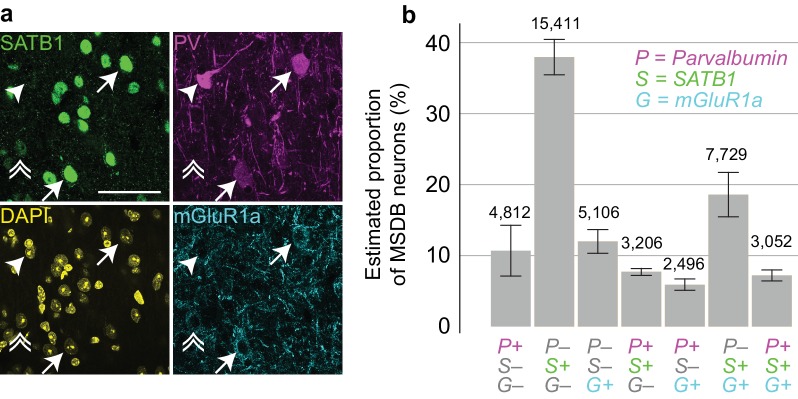
Figure 7.

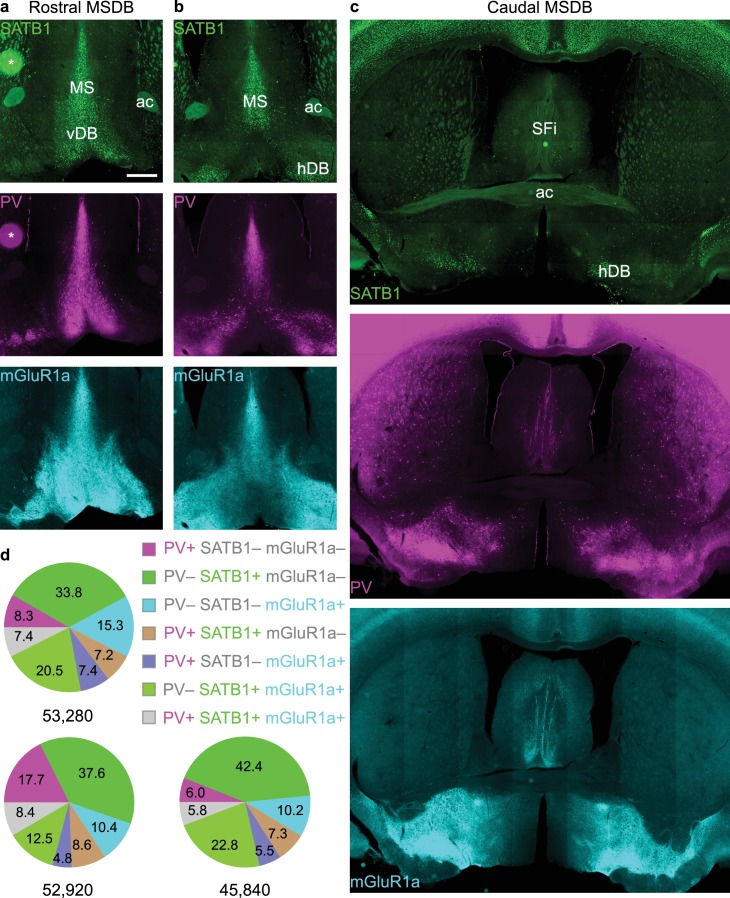
Figure 7—figure supplement 1. Stereological estimation of the number of neurons immunoreactive for PV and/or SATB1 and/or mGluR1a across the entire MSDB.

Figure 7—figure supplement 1.

(a-c) Widefield epifluorescence montages of coronal sections of the MSDB at three different rostro-caudal levels. Nuclear SATB1 immunoreactivity (green) was used to define the borders of the MSDB. Asterisk marks a labeling artefact. PV, magenta; mGluR1a, cyan. (d) Pie charts of estimated proportions (%) of neurons across the entire MSDB tested for immunoreactivity for the three molecules (based on n = 444, 441 and 382 neurons counted from three mice). Total number of estimated neurons are shown below each pie chart. Scale bar (a–c) 500 µm. MS, medial septum; vDB, vertical Diagonal Band; ac, anterior commissure; hDB, horizontal Diagonal Band; SFi, septofimbrial nucleus.