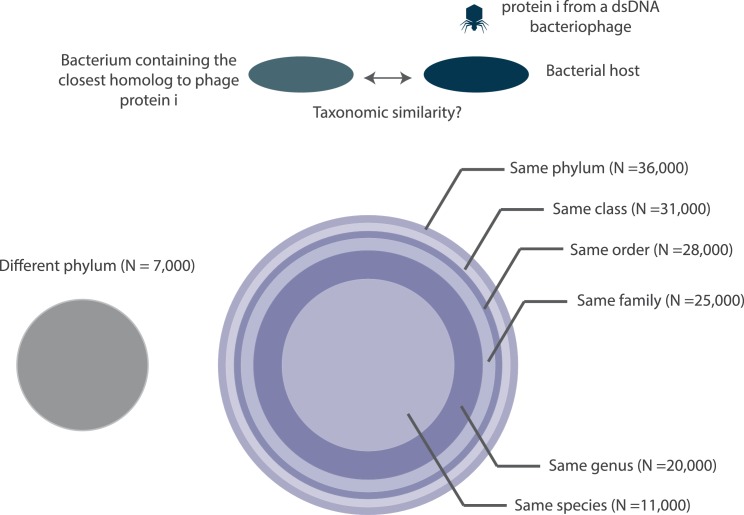
Figure 10. A depiction of the taxonomic distance between the bacteriophage host organism and the bacterium containing the closest homolog to a bacteriophage protein.
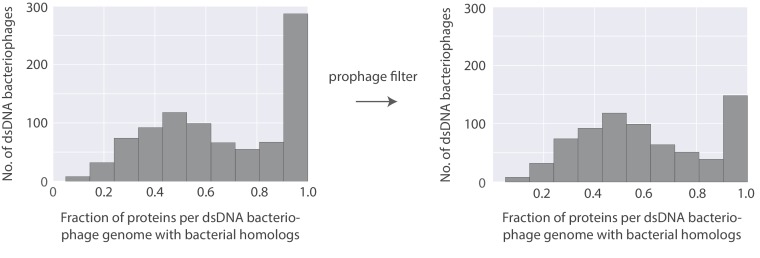
All circles are drawn to scale with respect to the number of proteins (N) that they each represent. Note, the number of proteins denoted at each taxonomic layer includes proteins in lower taxonomic layers. For example, the 20,000 figure denoted at the genus layer already includes the 11,000 proteins shown at the species layer. N values are rounded to the nearest thousand. Histograms of the fraction of proteins with bacterial homologs per bacteriophage genome are shown in Figure 10—figure supplement 1.


