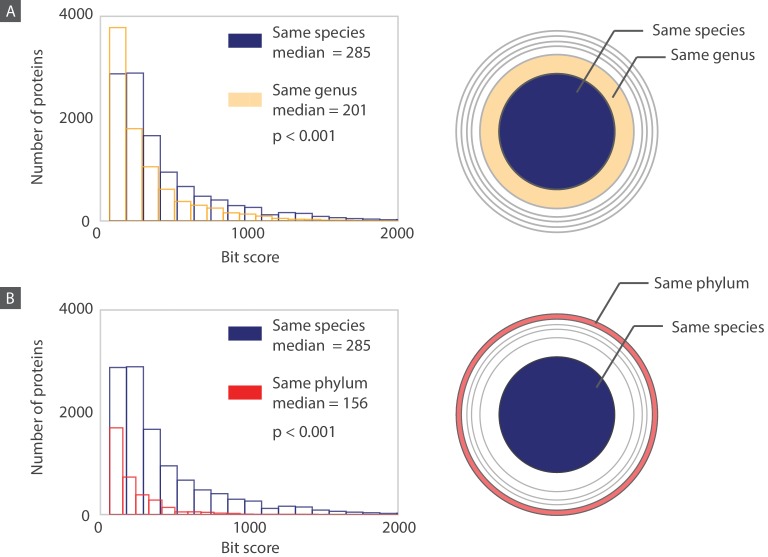
Figure 11. Histograms of bit scores describing the match between each bacteriophage protein and its closest bacterial homolog.
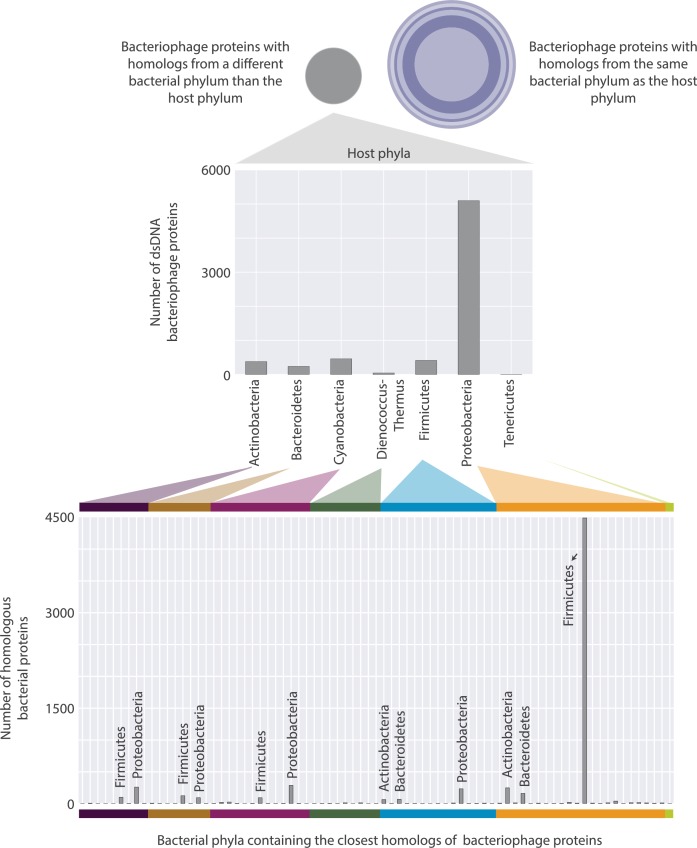
Histograms are created according to the proteins belonging to three different layers corresponding to an increasing taxonomic distance between the host organism and the bacterium containing the closest homolog. (A) When the host and the homolog-containing bacterium belong to the same species, the median bit score is significantly higher (one sided Mann-Whitney U test, P<0.001) than it is for those that are only part of the same genus. (B) Similarly, when comparing proteins from the “same species” layer to the “same phylum” layer, the median bit score is significantly higher for the “same species” layer (one sided Mann-Whitney U test, P<0.001). Note that for each layer, when comparing the “same species” to the “same genus” layers, we are comparing the 11,000 proteins in the “same species” layer to the 9,000 proteins from the “same genus” layer that do not also belong to the “same species” layer. The same principle applies when we are comparing the “same species” layer to the “same phylum” layer. Distributions of bacteriophage proteins with homologs from a different phylum than their host phylum are shown in Figure 11—figure supplement 1.


