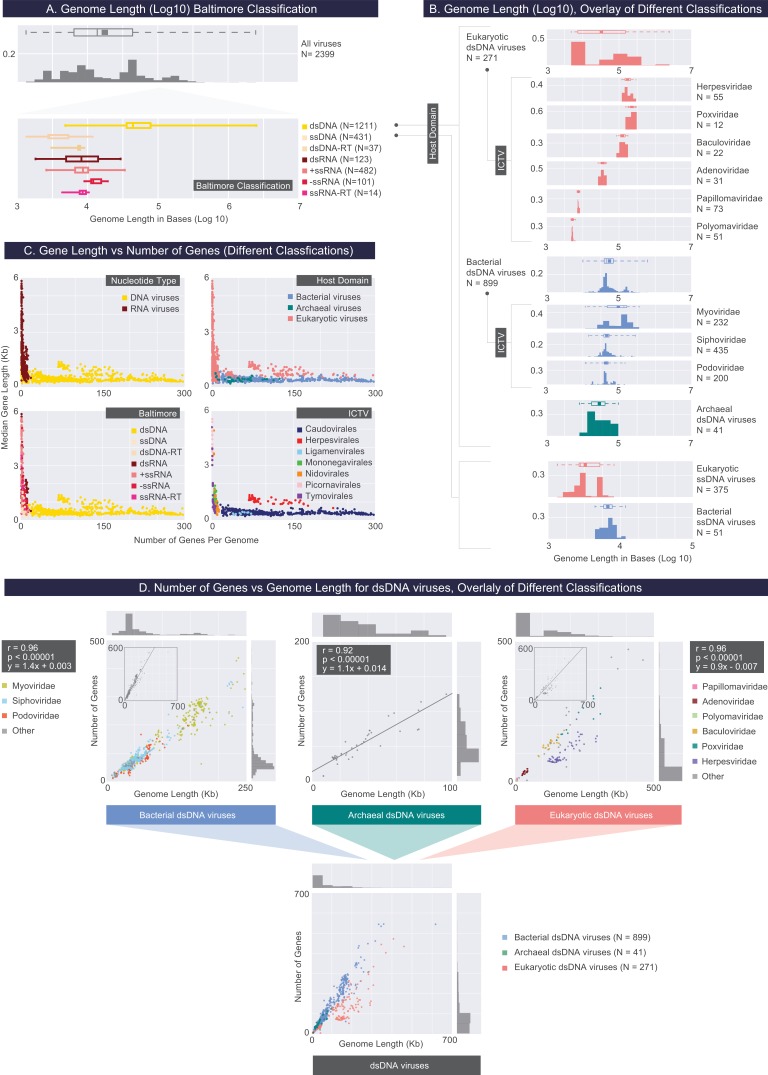
Figure 3. Describing viral genomes through distributions of genome length, gene length and gene density.
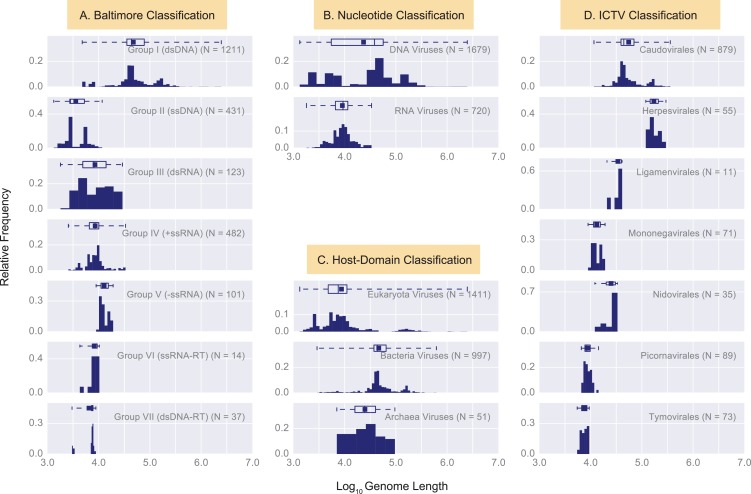
(A) Box plots of genome lengths (Log10) across all viruses included in our dataset (top), further partitioned based on the Baltimore classification categories (bottom). The number of viruses included in each group is denoted by N. (B) A closer examination of dsDNA and ssDNA viral genome lengths through the overlay of Host Domain and ICTV classification systems. Distributions of genome lengths associated with eukaryotic, bacterial and archaeal viruses are shown in salmon, blue, and teal, respectively. ICTV viral families with only a few members are omitted. Distributions of genome lengths across different classification systems along with various statistics are shown in Figure 3—figure supplement 1. and Figure 3—source data 1. Note that the bimodal distribution of eukaryotic ssDNA viruses, which also appears in the next figure, arises from the Begomoviruses, which are plant viruses with circularized monopartite and bipartite genomes (Melgarejo et al., 2013). (C) Median gene length is plotted against the number of genes for each genome for all genomes in our dataset, color-coded according to different classification systems. (D) Number of genes per genome length (gene density) for dsDNA viruses based on the overlay of Host Domain (bottom) and ICTV family classification categories (top) (Pearson correlations and their statistical significance, two-tailed t-test P values, are denoted).


