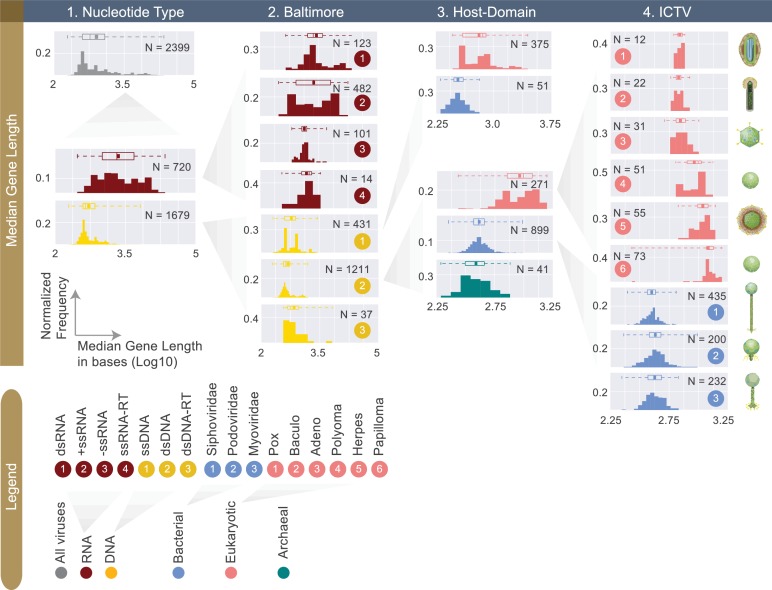
Figure 4. Normalized histograms of median gene lengths (log10) across all complete viral genomes associated with a host.
Instead of showing absolute viral counts on y-axes, the counts are normalized by the total number of viruses in each viral category (denoted as N inside each plot). The mean of each distribution is denoted as a dot on the boxplot. For all histograms, bin numbers and bin widths are systematically decided by the Freedman-Diaconis rule (Reich et al., 1966). Viral schematics on the right of the figure are modified from ViralZone (Hulo et al., 2011). Key statistics describing these distributions can be found in Table 1 and Figure 4—source data 1.

