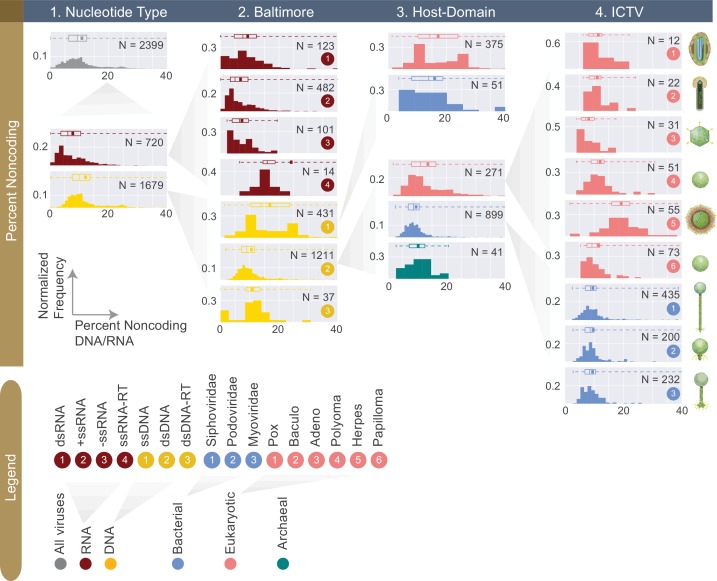
Figure 5. Normalized histograms of noncoding DNA/RNA percentage across all complete viral genomes associated with a host.
The counts of viruses are normalized by the total number of viruses in each viral category (denoted as N inside each plot). The mean of each distribution is denoted as a dot on the boxplot. For all histograms, bin numbers and bin widths are systematically decided by the Freedman-Diaconis rule (Reich et al., 1966). Viral schematics are modified from ViralZone (Hulo et al., 2011). Key statistics describing these distributions can be found in Table 1 and Figure 5—source data 1.

