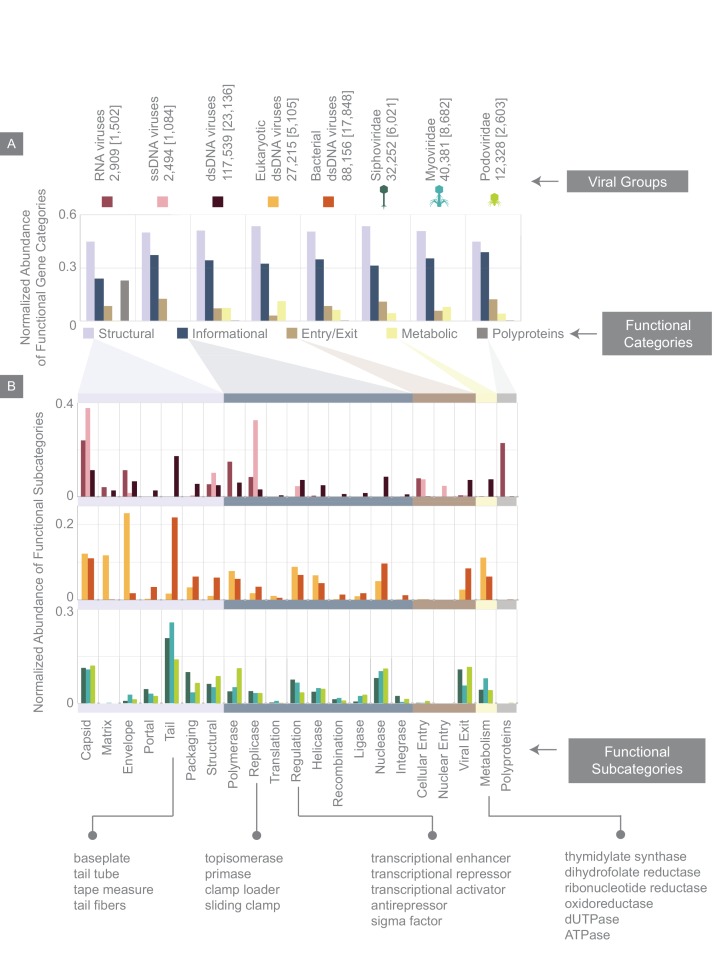
Figure 6. Normalized abundance of functional gene categories across different viral groups.
(A) Abundances of functional gene categories across 8 viral groups normalized to the number of labeled genes in each viral group (the total number of genes in each viral group is shown above the panel, and in brackets are the number of labeled genes for each viral group). (B) Abundances of functional gene subcategories across 8 viral groups: RNA, ssDNA, and dsDNA viral groups (top plot); eukaryotic and bacterial dsDNA viral groups (middle); Siphoviridae, Myoviridae, and Podoviridae viral groups (bottom). A few examples of the types of genes contained as part of each functional subcategory are provided.

