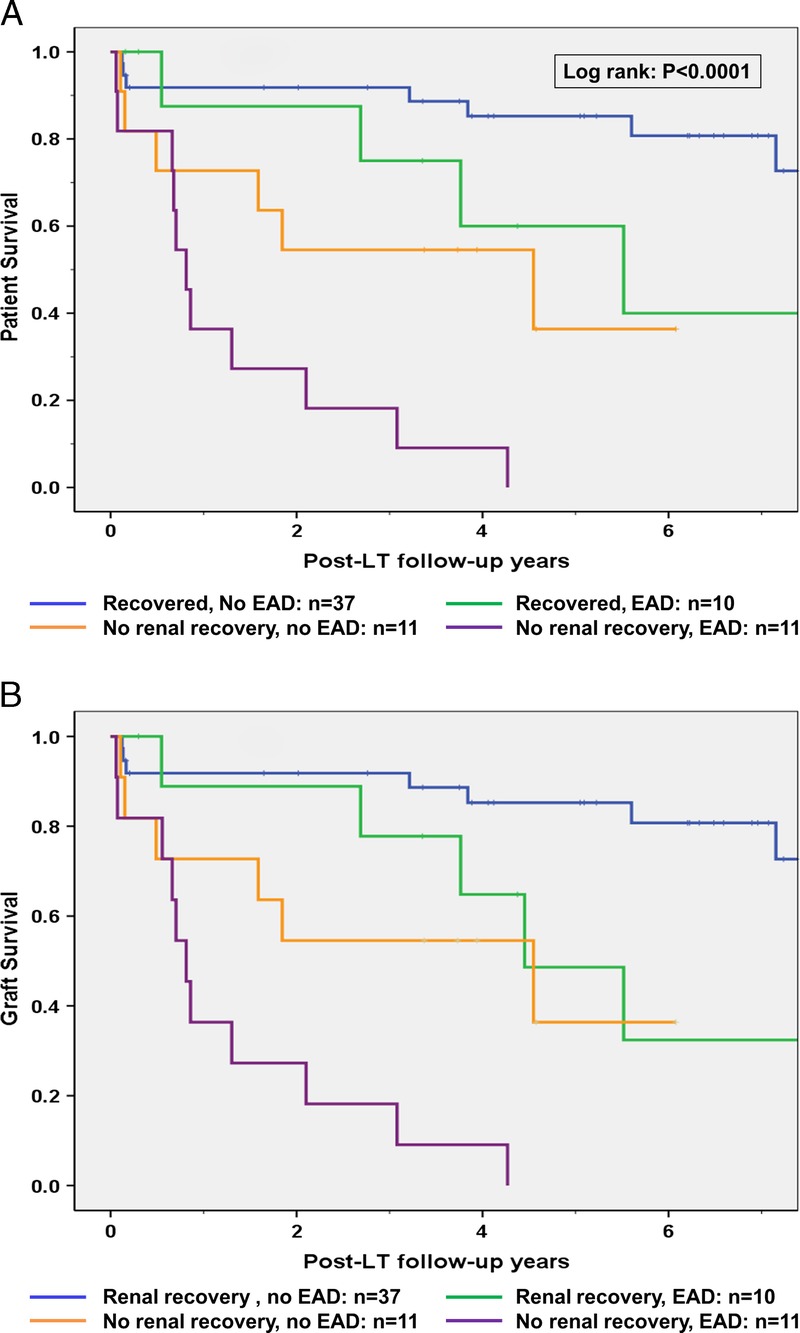
FIGURE 3.

A and B, Patient (A) and liver graft (B) survival of 69 primary LT recipients grouped according to post-LT renal recovery and EAD development. Group 1: Recovered kidney function, no EAD (n = 37). Group 2: Recovered kidney function, developed EAD (n = 10). Group 3: No renal recovery, no EAD (n = 11). Group 4: No renal recovery and developed EAD (n = 11). As demonstrated in panels A and B, patients in group 1 had the best post-LT outcomes, whereas none in the patients in group 4 survived 5 years after LT.
