FIGURE 1.

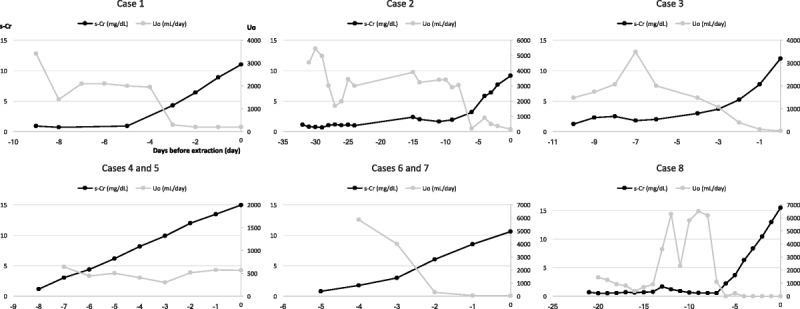
Trends of serum Cr concentrations (mg/dL) and urine outputs (mL/d) in donors until donation. Patients 4/5 and patients 6/7 were transplanted grafts from the same donors.

Trends of serum Cr concentrations (mg/dL) and urine outputs (mL/d) in donors until donation. Patients 4/5 and patients 6/7 were transplanted grafts from the same donors.