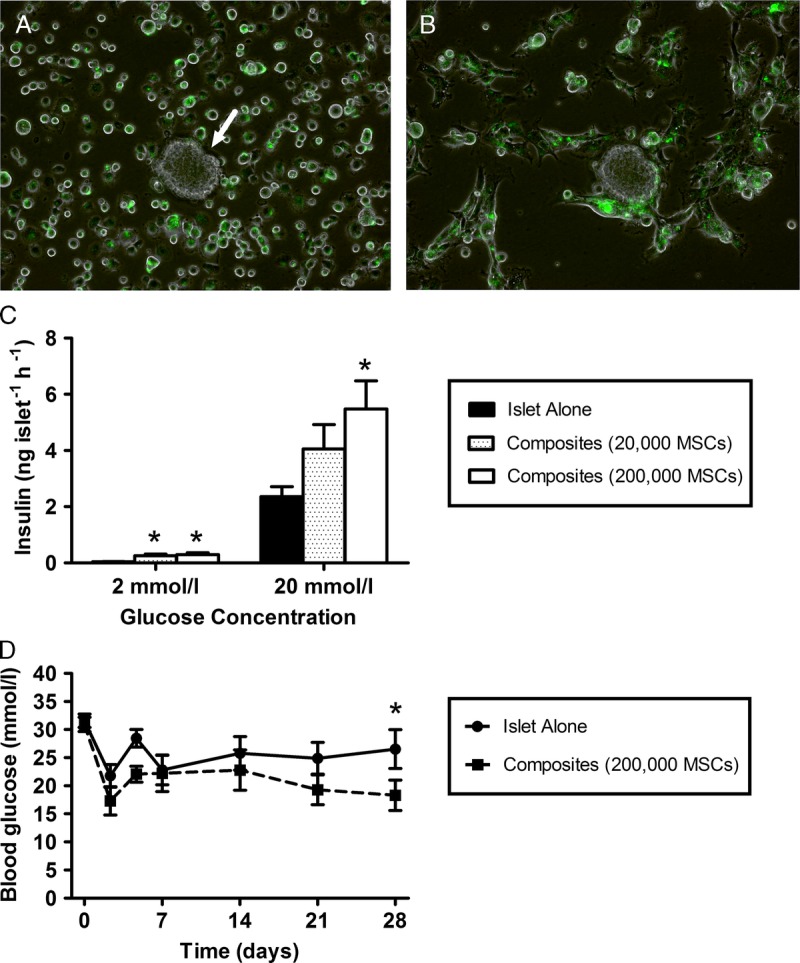
FIGURE 1.

Seventy-five mouse islets were precultured with 200 000 fluorescently labeled (Qtracker 525 cell labeling kit; Invitrogen) mouse MSCs (green), per 35-mm dish, in suspension coculture for 24 hours to form composite MSC-islets. A single islet (white arrow) surrounded by MSCs (green) at the beginning of the coculture period (A). MSCs adhere to the edge of the islet after 2 hours of culture (B) and MSCs penetrate the islet core after 8 hours, leading to the formation of MSC-islet composites. Scale bar 100 μm. C, Insulin release at 2 and 20 mmol/L glucose of 10 replicates of 3 islets per Eppendorf tube, precultured alone (black bar) for 24 hours, or in suspension coculture with 20 000 (dotted bar), or 200 000 MSCs (white bar), to form MSC-islet composites, *P < 0.01 versus islets precultured alone at the same glucose concentration. D. Average blood glucose concentrations of mice receiving intraportal transplantations of 200 islets precultured with MSCs (at a ratio of 75 islets: 200 000 MSCs per 35-mm dish) in suspension coculture for 24 hours to form composites (dashed line) or islets precultured alone for 24 hours (solid line), *P < 0.05 vs. mice transplanted with MSC islet composites (repeated-measures ANOVA with Bonferroni post hoc test, n = 6 for both transplant groups). ANOVA, analysis of variance.
