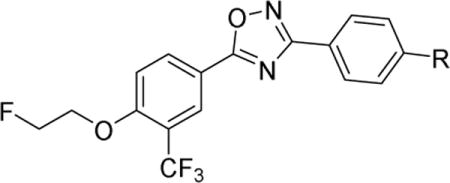
Table 1.

| ||||||
|---|---|---|---|---|---|---|
| Compd. | R | S1PR1 IC50 (nM) | MW | ClogP | TPSA | HBD |
| S1P | 1.4 ± 0.3 | 379.5 | 4.1 | 113.0 | 4 | |
| 9a |
|
13.2 ± 3.2 | 431.4 | 3.4 | 103.3 | 1 |
| 9b |
|
67.1 ± 12.6 | 395.3 | 3.7 | 86.3 | 1 |
| 9c |
|
40.0 ± 17.8 | 459.4 | 3.7 | 89.4 | 1 |
| 10a |
|
> 1000 | 396.3 | 4.9 | 80.5 | 1 |
| 10b |

|
272 ± 65 | 411.3 | 3.3 | 92.5 | 2 |
| 10c |

|
14.7 ± 1.7 | 410.3 | 3.3 | 98.3 | 2 |
| 12a |
|
341 ± 126 | 477.4 | 4.2 | 108.4 | 1 |
| 12b |
|
9.7 ± 1.6 | 463.4 | 3.1 | 91.4 | 1 |
| 15 |
|
156 ± 47 | 464.5 | 4.1 | 72.4 | 1 |
| 16a |
|
99.8 ± 12.2 | 439.4 | 1.3 | 92.5 | 2 |
| 16b |
|
6.3 ± 1.3 | 453.4 | 2.0 | 92.5 | 2 |
| 21a |
|
34.2 ± 7.1 | 381.3 | 4.0 | 69.2 | 1 |
| 21b |
|
44.2 ± 6.8 | 425.4 | 4.1 | 78.4 | 1 |
IC50 values were determined at least 3 independent experiments, each run was performed in duplicate; Assays for compounds which showed no activity (IC50 > 1000 nM) were only repeated twice;
MW, ClogP, TPSA, and HBD were calculated by ChemDraw Professional 16.0.1.4 (77) (PerkinElmer Informatics, Inc.).
