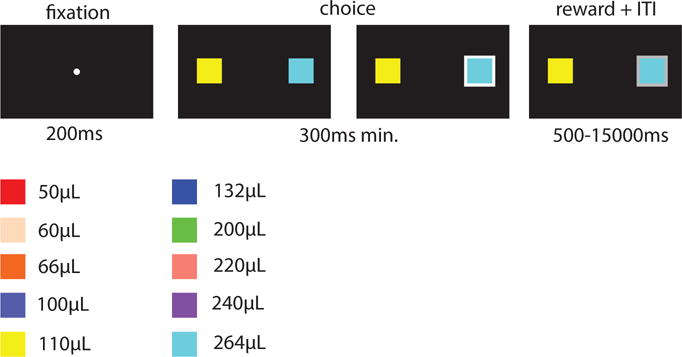
Figure 4.

Time course of an experimental trial and reward values for the two alternatives for the monkey experiment. RGB values for stimuli were as follows: – red: [255 0 0] – off-white: [255 218 185] – orange: [255 102 0] – indigo: [78 90 200] – yellow: [255 255 0] – blue: [0 0 255] – lime green: [0 255 0] – pink: [250 128 114] – purple: [160 32 240] – cyan: [0 255 255] – white (fixation dot): [255 255 255].
