
Figure 5.
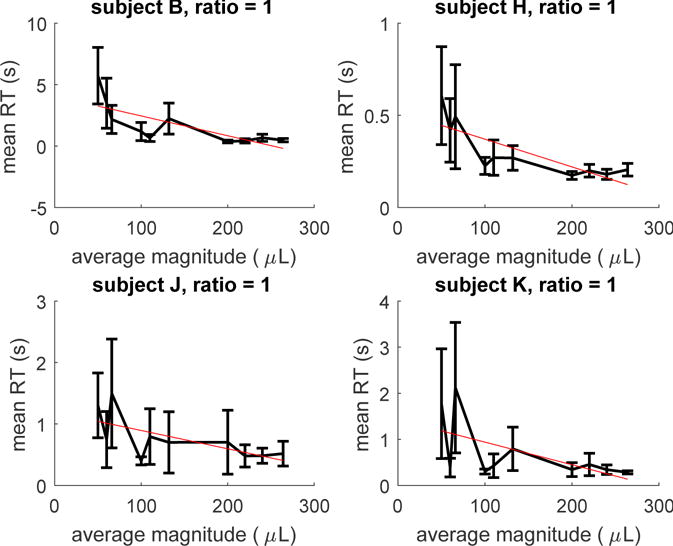
Mean RTs for the equal alternatives conditions of increasing magnitude for each subject (monkey study). Bars represents 95% confidence intervals. The red (straight) line represents the linear regression line on mean RTs.
Official websites use .gov
A
.gov website belongs to an official
government organization in the United States.
Secure .gov websites use HTTPS
A lock (
) or https:// means you've safely
connected to the .gov website. Share sensitive
information only on official, secure websites.
Mean RTs for the equal alternatives conditions of increasing magnitude for each subject (monkey study). Bars represents 95% confidence intervals. The red (straight) line represents the linear regression line on mean RTs.