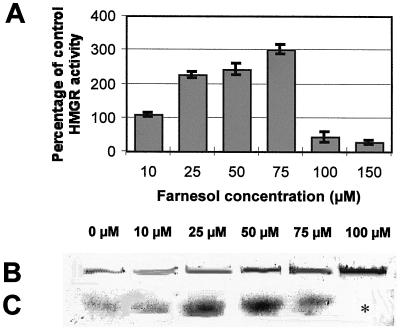
Figure 4.
Influence of farnesol treatment on apparent activity of microsome-bound HMGR. TBY-2 cells were treated for 48 h with different concentrations of farnesol before the isolation of membranes. A, Enzyme activity in TBY-2 cells treated by farnesol. Activity was always measured in the presence of 30 μm R,S-[3-14C]HMG-CoA (10-fold Km) and of 30 μg of microsomal protein. Control, Untreated cells. 100% activity corresponds to 4.8 nmol mg−1 h−1 (80 pmol mg−1 min−1). Mean of three independent experiments. B, Western-blot analysis of HMGR protein. All lanes contained 15 μg of protein; an identical gel was run in parallel and used for silver staining to be sure that the intensity of individual protein bands was identical for each lane (not shown). C, Northern-blot analysis of HMGR RNA. All lanes contained 20 μg of total RNA. Intensity of major ribosomal RNA bands on the agarose gel was identical for each lane. *, Not determined.

