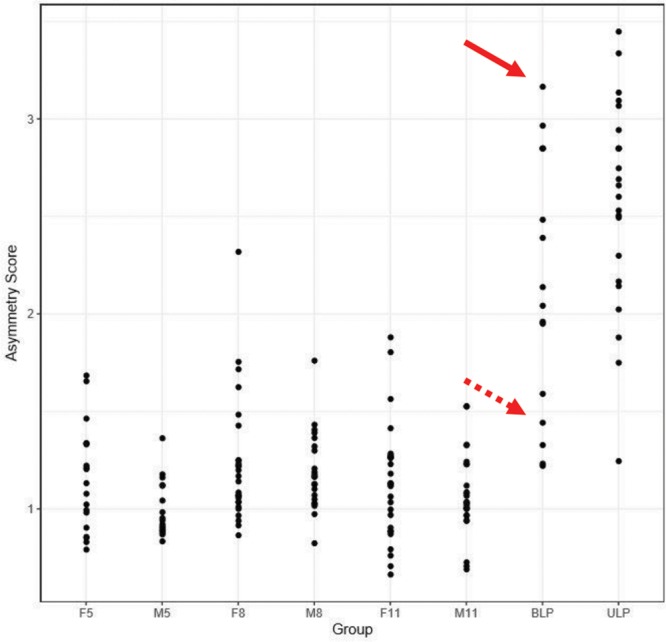
Fig. 11.

Plots of the “paired” asymmetry scores (2) for the whole face of patients with CL/P and controls. The solid arrows indicate the position of patient 1 in Figure 12, and the broken arrows indicate the position of patient 2 in Figure 12. F5 indicates control females 5–7 years of age; F8, control females 8–10 years of age; F11, control females 11–14 years of age; M5, control males 5–7 years of age; M8, control males 8–10 years of age; M11, control males 11–14 years of age.
