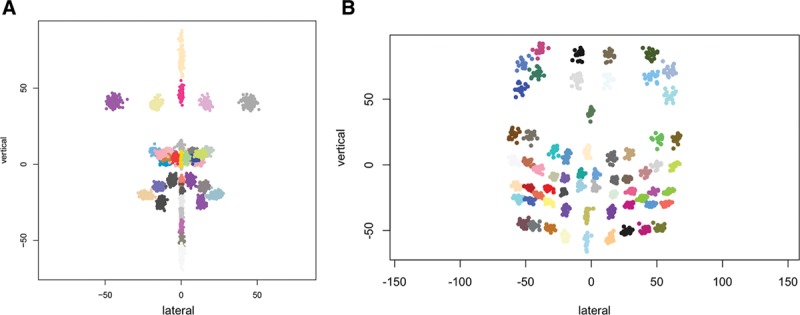
Fig. 3.

Landmark distributions. A, Frontal view of facial landmark distributions over all subjects (patients with CL/P and controls) in sample 1. B, Frontal view of facial landmark distributions over all subjects (patients with FP and controls) in sample 2.
