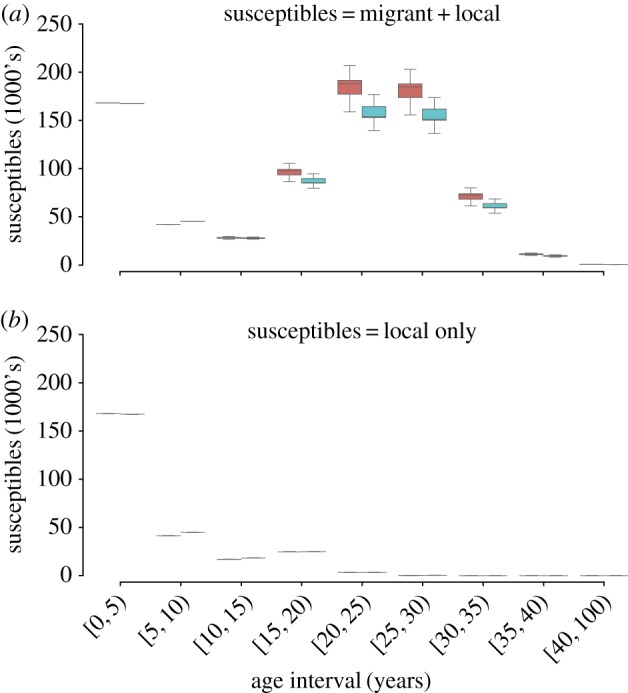
Figure 3.

(a) The estimated total number of susceptible individuals in each age class based on data observed on 15 July using the age confirmation model (red) and the clinical only model (blue). (b) The estimated number of resident susceptibles—total susceptibles minus excess susceptibles—in each age class based on data observed on 15 July using the age confirmation model (orange) and the clinical only model (blue).
