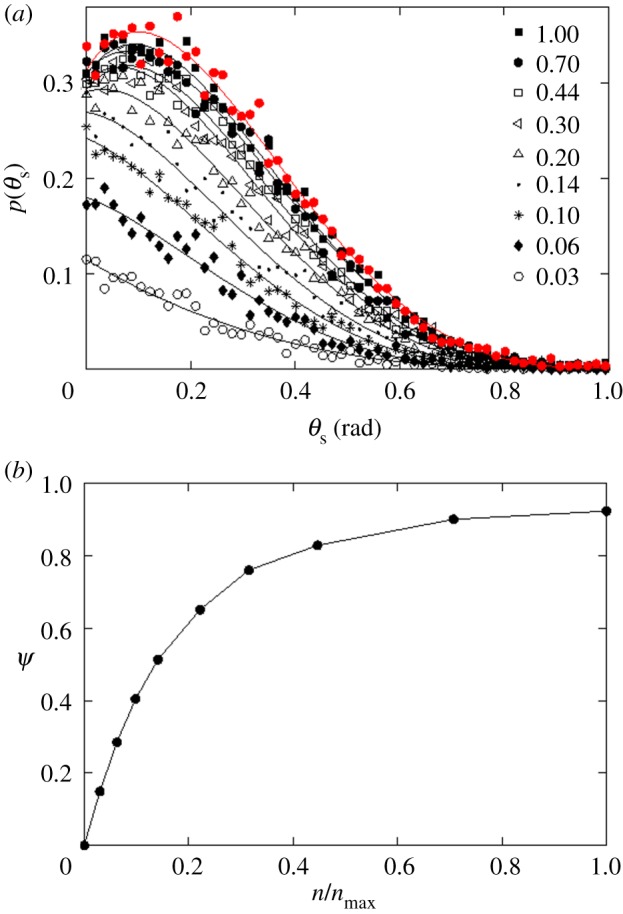
Figure 3.

Effect of receptor expression on the targeting efficacy in the absence of non-specific particle uptake (ρ = 0). Only receptor-mediated particle uptake is allowed. (a) p(θs) represents the probability of capture of a particle with starting angle θs (figure 1). The red curve represents a hypothetical case of infinite receptor expression ( ). The black curves represent finite levels of receptor expression, as indicated in the legend.
  correspond to 396 receptors (maximum number of receptors in the model). Each discrete point (value of p(θs)) is calculated from 1000 particle trajectories starting from the corresponding θs. The solid lines represent polynomial fits. (b) Targeting efficacy (ψ) (equation (2.6)) at different levels of receptor expression (
 ).
).
