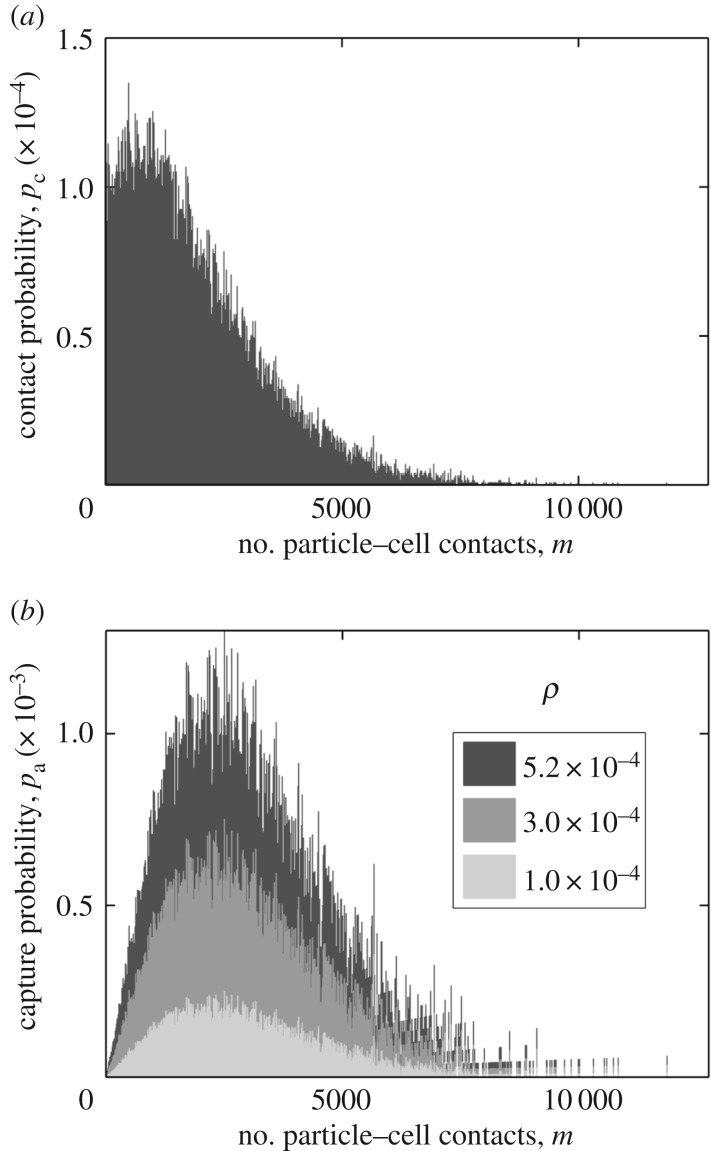
Figure 9.
Analysis of multicollision particle–cell interaction. (a) Distribution of number of particle–cell contacts for particles with starting angle θs = 0. A total of 105 particles, all with starting angle θs = 0, were simulated considering no particle capture by the cell (ρ = 0 and  ). Based on the number of contacts with the cell boundary, the particles were distributed in 1000 uniform bins, and the population in each bin was normalized, as discussed in §3.5. (b) The effective probability of particle capture: pa = ρm(pΔm), where p is the corresponding Y -axis value in (a). The probability distribution is shown for three distinct values of ρ, as indicated in the legend.

